Global Regional Market Performance Analysis - Providing Business Insight
RM0600002_14
- Last Update 02/23/2025
- File Size 1.3MB
- # of Slides 2
- File Format PPTX
- Slide Ratio 16:9
- Color
Keywords
- #Content-Based Slides
- #Design-Based Slides
- #Company Introduction
- #Market and Competitor Analysis
- #Diagram
- #Other
- #Global Network
- #Target Market
- #Table
- #Map
- #16:9
- #regional market analysis PPT slide
- #global performance analysis PowerPoint
- #map-based data visualization slide
- #regional comparison chart
- #market analysis presentation template
About the Product
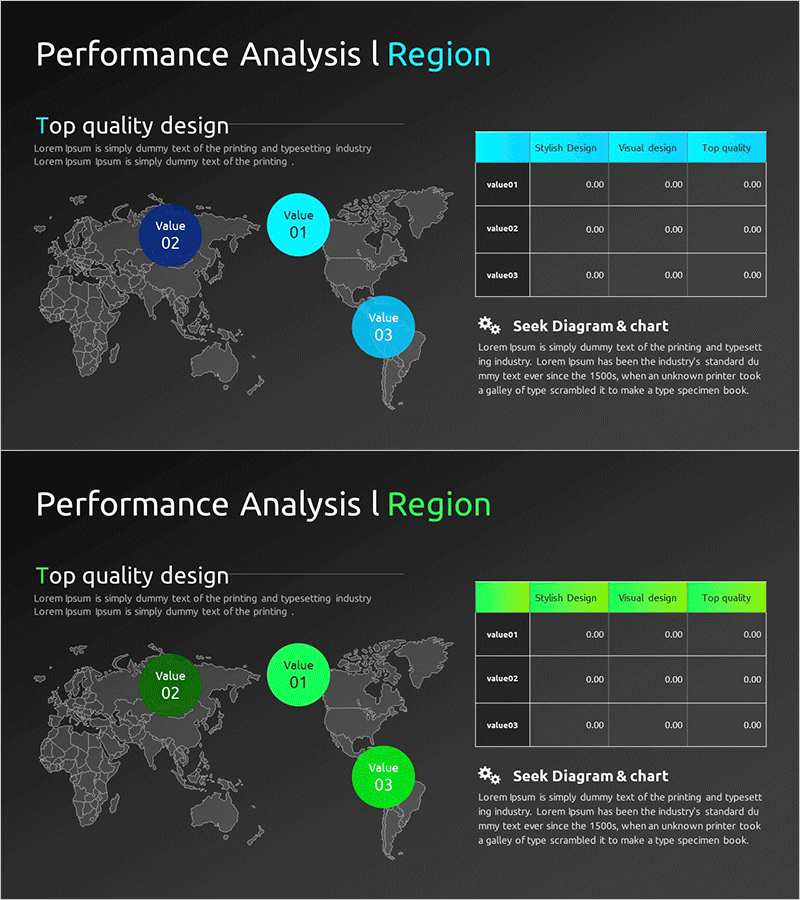
A PowerPoint slide designed to analyze and compare global market performance across regions. The slide features a world map with three regional performance data points visualized as circular markers, complemented by a data table on the right displaying key metrics. The dark background with cyan and lime accent colors highlights the data effectively, while text descriptions, map visualization, and tabular data are balanced across the layout. Ideal for investor presentations, executive briefings, and strategic market planning sessions where global business insights are critical.
Usage Points
-
Main Usage
This slide enables clear comparison and analysis of global market performance across regions, presenting both spatial distribution and quantitative metrics to investors and executives. The combination of map-based location markers and numerical data tables facilitates comprehensive understanding of regional market dynamics and business outcomes.
-
How to Use
Deploy this slide in investment pitch presentations during market analysis sections, quarterly or annual business review reports for global performance metrics, and strategic marketing meetings for regional performance evaluation. Customize region names and data values with your own figures for immediate presentation use.
-
Recommended For
Recommended for global company executives and investor relations teams, marketing and sales professionals analyzing regional performance, consulting firms conducting market analysis projects, and startups preparing investment pitches. Suitable for any business scenario requiring regional expansion strategy discussion or market share comparison.
-
Slide Structure
The slide comprises a title and descriptive text area (top-left), a world map visualization with three circular regional markers (center-left), and a performance metrics table (right side). The table displays three performance categories (Stylish Design, Visual design, Top quality) with three data rows (value01-03), enabling straightforward multi-region comparison and analysis.
Related Products
-

Global Market Analysis – Global Network and Target Market
#Company Introduction #Market and Competitor Analysis #Diagram
-

Global Network Affiliation Status – Market Trend Analysis
#Company Introduction #Market and Competitor Analysis #Diagram
-

Target Market Analysis by Region – Global Marketing Strategy
#Company Introduction #Market and Competitor Analysis #Diagram
-

Country-by-Country Revenue Analysis Table – Data-Driven Insights
#Company Introduction #Market and Competitor Analysis #Diagram
