Risk Management Process Diagram – Clarifying Operations Planning
RM0500010_23
- Last Update 02/22/2025
- File Size 0.4MB
- # of Slides 2
- File Format PPTX
- Slide Ratio 16:9
- Color
Keywords
- #Content-Based Slides
- #Design-Based Slides
- #Operational Plan
- #Diagram
- #Risk Management
- #Post-Implementation Management & Maintenance
- #Flow
- #Linear Flow
- #16:9
- #risk management diagram PowerPoint
- #4-step process slide
- #linear diagram template
- #operational planning PPT
- #risk management process slide download
About the Product
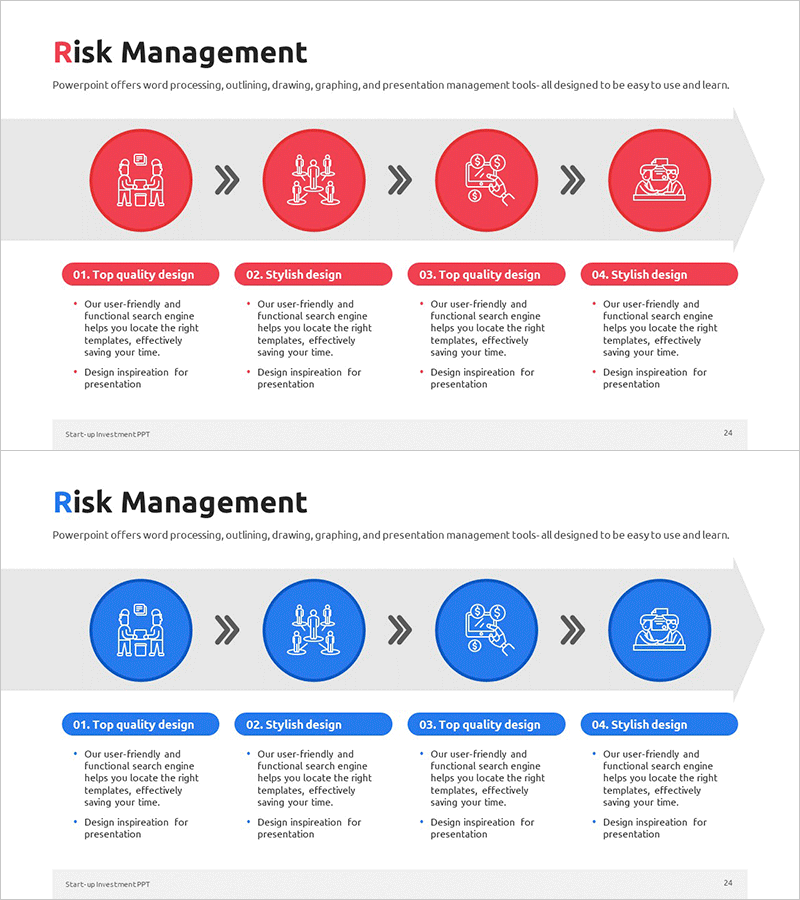
A linear process diagram PowerPoint slide visualizing the four stages of risk management connected by directional arrows. Each stage features an icon and descriptive text to clearly illustrate the flow of operational planning. The red and blue dual-tone circular nodes emphasize the role of each stage, while arrows represent the sequential progression of the process. The 2-slide set provides both red and blue versions, allowing you to match your presentation's color scheme. Instantly applicable to risk management, operational planning, and process improvement presentations.
Usage Points
-
Main Usage
Visually represents the four stages of risk management (plan → identify → analyze → respond) to clearly communicate organizational operational planning and risk response systems. Helps executives and team members intuitively understand the flow of risk management procedures.
-
How to Use
Place in the operational planning section of business plans, management reports, or risk management policy presentations. Customize the text under each stage icon to reflect your organization's specific activities. Select the red version to emphasize urgency and caution, or the blue version to convey trust and stability.
-
Recommended For
Executives, risk managers, operations managers, audit departments, and consultants explaining risk management frameworks. Suitable for business plans, management disclosures, audit reports, organizational restructuring announcements, and process improvement proposals where operational planning structure needs visualization.
-
Slide Structure
2-slide set. Each slide features four circular nodes with icons sequentially connected by directional arrows in a linear layout. Title at the top, descriptive text areas for each stage at the bottom. Slide 1 uses red tone, Slide 2 uses blue tone, maintaining identical structure with color variation only.
Related Products
-

Automotive Risk Management Overview – Visualizing Driving Skills Enhancement
#Operational Plan #Diagram #Risk Management
-

Visualizing Maintenance Process with Diagram – Risk Management
#Operational Plan #Diagram #Risk Management
-

Medical Business Risk Compensation Diagram
#Operational Plan #Diagram #Risk Management
-

Risk Management Linear Diagram – Operational Planning Review
#Operational Plan #Diagram #Risk Management
