Consumer Trend Changes and Market Outlook – Market Trends Analysis
RM0500010_10
- Last Update 02/22/2025
- File Size 0.4MB
- # of Slides 2
- File Format PPTX
- Slide Ratio 16:9
- Color
Keywords
About the Product
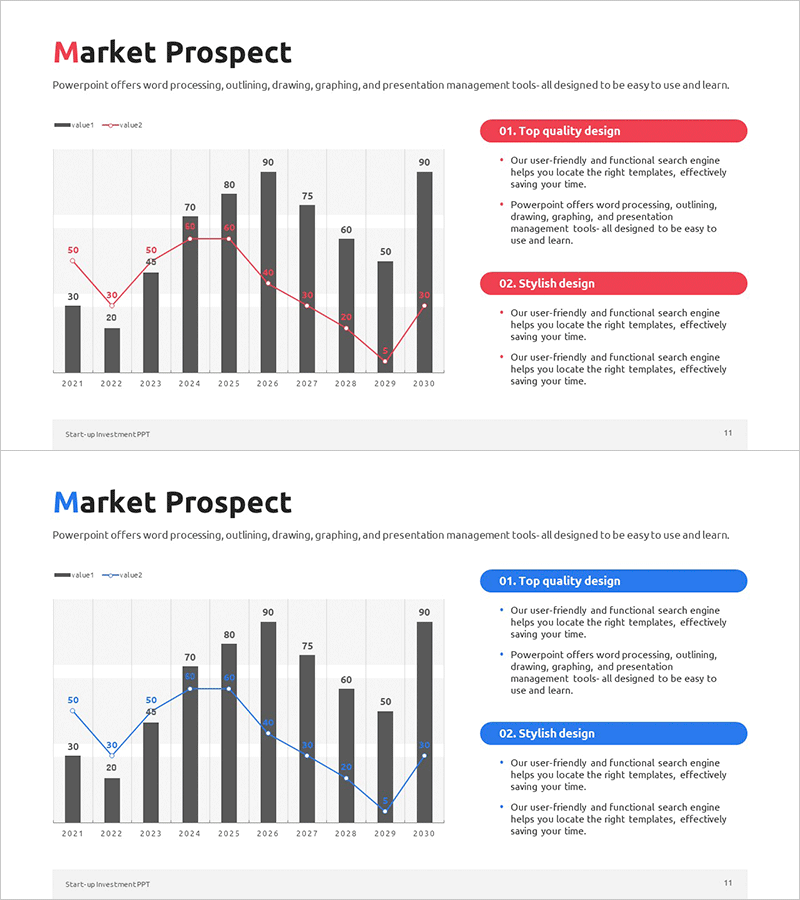
A 2-slide PowerPoint presentation template visualizing consumer trends and market outlook. This slide deck combines bar graphs and dual-line charts to compare market data from 2021 to 2030. The left side displays 10-year quantitative data through visual charts, while the right side organizes key insights in text boxes. Red and blue accent badges highlight critical findings to maximize presentation impact. Optimized for 16:9 widescreen format, this template allows you to input your own data and deploy immediately for market analysis presentations.
Usage Points
-
Main Usage
Present market conditions and consumer trend changes using quantitative data visualization. The dual-line chart and bar graph enable side-by-side comparison of market dynamics over time, while the right-side text boxes emphasize key insights to support strategic decision-making.
-
How to Use
Deploy in business plans, investor pitch decks, and marketing strategy presentations within the market analysis section. Input actual market data into the left-side charts and populate the right-side accent badges with key findings to direct audience attention. The red-blue color scheme clearly distinguishes between two data indicators.
-
Recommended For
Strategy planners, marketing managers, business development professionals, and investor relations teams presenting market analysis results. Particularly effective for competitive benchmarking, market share trends, consumer preference shifts, and multi-metric comparative analysis.
-
Slide Structure
Two-slide layout with each slide containing one title area, one chart area, and two text input zones including accent badges. Features 10-item bar graphs plus dual-line charts for time-series data representation, with two emphasis point boxes on the right side to deliver both quantitative metrics and qualitative interpretation simultaneously.
Related Products
-

Industry Growth Rate and Trend Analysis Chart – Market Prospect
#Market and Competitor Analysis #Graph #Other
-

Graph Comparing Transportation Methods – Market Overview Analysis
#Market and Competitor Analysis #Graph #Other
-

Area Chart for Science Topics – Gain Competitive Advantage through Data Analysis
#Market and Competitor Analysis #Graph #Other
-

Bar Chart Visualizing Yacht Tour Satisfaction
#Market and Competitor Analysis #Graph #Other
