Business Infrastructure Diagram - Business Introduction and Data Visualization
RM0500008_11
- Last Update 02/22/2025
- File Size 0.3MB
- # of Slides 2
- File Format PPTX
- Slide Ratio 16:9
- Color
Keywords
- #Content-Based Slides
- #Design-Based Slides
- #Business Introduction
- #Diagram
- #Business Areas
- #Infrastructure
- #Structure
- #Tree Diagram
- #16:9
- #business infrastructure diagram PowerPoint
- #radial structure slide template
- #4-element hub diagram
- #business foundation visualization
- #corporate structure diagram download
About the Product
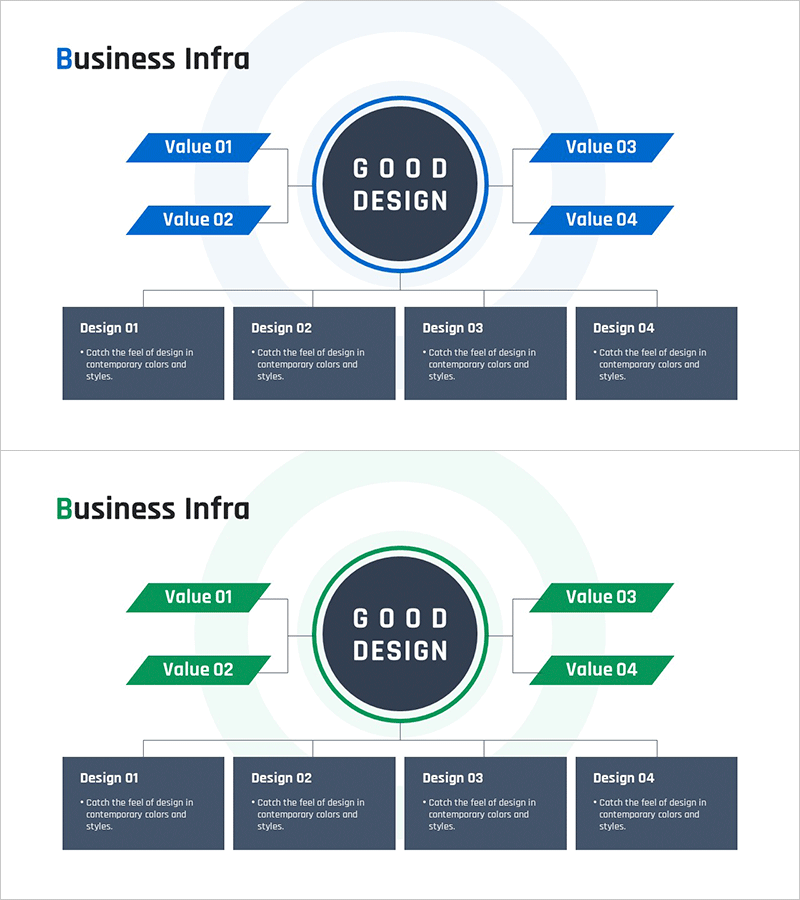
A radial structure diagram PowerPoint slide featuring a central hub connected to four value elements arranged symmetrically. Provided in two color versions—blue and green—with detailed description boxes positioned below each element. This presentation slide is ready to use for business foundation visualization, corporate value communication, and data representation in business presentations. Available in 16:9 widescreen PPTX format, fully editable in all presentation software.
Usage Points
-
Main Usage
Clearly present your company's core business foundation and four key value elements in a single visual. Ideal for company introductions, business strategy presentations, organizational structure explanations, and business model visualizations that require clear communication of complex information.
-
How to Use
Enter your core concept (company name, core value, business objective) in the central circle. Fill in the four arrow boxes with detailed elements, then add comprehensive descriptions in the four boxes below. Choose between blue or green color scheme to match your corporate brand identity.
-
Recommended For
Executives, business development teams, marketing professionals, consultants, and educators presenting business strategies, organizational structures, and business models. Suitable for investor presentations, employee onboarding, business proposals, annual reports, and corporate communications.
-
Slide Structure
Two-slide set: First slide features blue version (central circle + 4 arrow boxes + 4 description boxes), second slide shows green version with identical layout. Each slide uses balanced 4-point distribution with one central element and four surrounding elements positioned at top-left, top-right, bottom-left, and bottom-right.
Related Products
-

Effectively Presenting Global Business Area Slide
#Business Introduction #Diagram #Business Areas
-

Introduction to the Apparel Business Area Program - Cluster Diagram
#Product/Service Introduction #Business Introduction #Diagram
-

Business Infrastructure Connectivity Diagram – Visualizing Strategic Business Areas
#Business Introduction #Diagram #Business Areas
-

Healthcare Business Infrastructure Diagram – Visualizing Business Areas
#Business Introduction #Diagram #Business Areas
