Science Experimental Area Diffusion Diagram – Connecting Innovative Ideas
RJ0400019_13
- Last Update 05/22/2025
- File Size 0.8MB
- # of Slides 2
- File Format PPTX
- Slide Ratio 16:9
- Color
Keywords
- #Content-Based Slides
- #Design-Based Slides
- #Business Introduction
- #Diagram
- #Business Areas
- #Infrastructure
- #Cluster
- #Spread
- #Chain Diagram
- #Centralized Diagram
- #16:9
- #radial diagram PowerPoint
- #central node slide template
- #5-item connection diagram
- #concept relationship chart PowerPoint
- #diffusion diagram slide design
About the Product
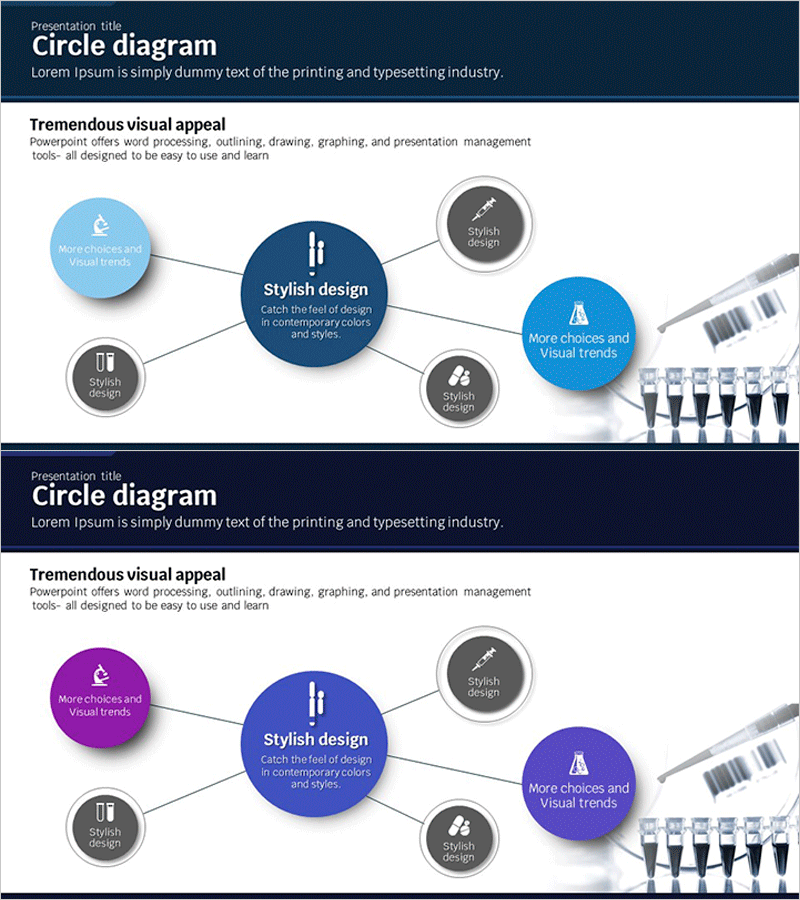
A radial diagram PowerPoint slide featuring a central dark blue node with five surrounding nodes in light blue and gray tones, connected by lines and icons. This 2-slide presentation template visualizes the relationship between a core concept and five related elements, making it ideal for business strategy, product features, organizational structure, and idea mapping. The slide set includes color variations in blue and purple tones, allowing flexible application across different presentation sections. Each node contains editable text areas for customization, enabling clear communication of hierarchical relationships and concept connections in professional presentations.
Usage Points
-
Main Usage
Effectively visualizes the relationship between a central concept and five related elements, making it ideal for presenting business strategies, product features, organizational structures, and idea mapping. The radial layout enables simultaneous display of multiple related items while maintaining clear visual hierarchy and connection relationships.
-
How to Use
Enter the core concept (e.g., company vision, product name, strategic goal) in the central dark blue node, and add five related items (e.g., features, values, implementation strategies) in the surrounding nodes. Edit text and icons to match your presentation content, and use the color variation slides to apply different tones for different presentation sections.
-
Recommended For
Ideal for executives, planners, and marketing teams presenting strategy and business plans. Product development teams can use it for feature and characteristic explanations, while organizational development teams can apply it to structure and role descriptions. Highly effective for seminars, workshops, and report presentations where complex concepts need clear, simple visualization.
-
Slide Structure
2-slide set with each slide featuring a large central dark blue circular node (text input area) and five medium-sized circular nodes in light blue and gray tones positioned around it. Connection lines and icons represent relationships between nodes. The set includes color variations in blue and purple tones, providing visual diversity for different presentation sections.
Related Products
-

Business Infrastructure Connectivity Diagram – Visualizing Strategic Business Areas
#Business Introduction #Diagram #Business Areas
-

Healthcare Business Infrastructure Diagram – Visualizing Business Areas
#Business Introduction #Diagram #Business Areas
-

Business Infrastructure Pentagon Diagram – Effective Business Presentation
#Business Introduction #Diagram #Business Areas
-

Core Value-Centric Circular Strategy – The Future of Business
#Company Introduction #Business Introduction #Diagram
