Effectively Presenting Global Business Area Slide
RB0100042_7
- Last Update 03/05/2025
- File Size 8.8MB
- # of Slides 2
- File Format PPTX
- Slide Ratio 4:3
- Color
Keywords
About the Product
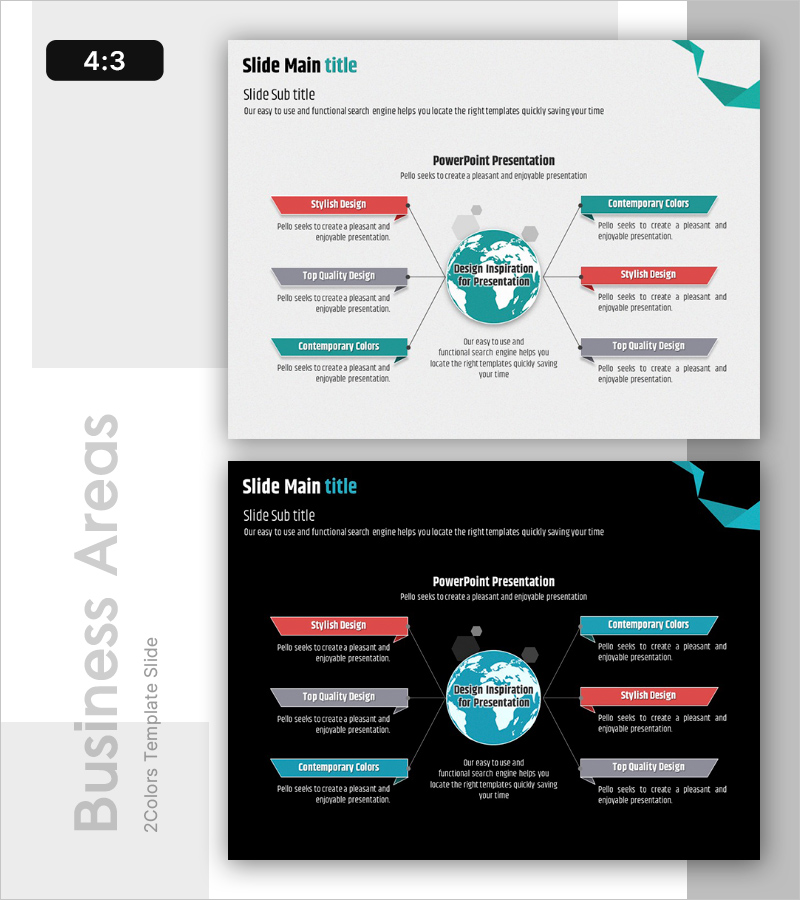
A central circular diagram PowerPoint slide that expands global business areas in six directions. The teal-colored central globe is surrounded by arrow boxes in red, gray, and teal positioned in four cardinal directions and two diagonal directions. Each box provides title and description text input areas for expressing business domains, strategies, and core competencies. Available in 4:3 ratio PPTX format for immediate editing in PowerPoint, suitable for company overview and business introduction presentations.
Usage Points
-
Main Usage
Visualize global business domains, scope, and strategic directions using a central circular structure to enhance audience comprehension. The six-direction expansion layout enables simultaneous representation of multiple business areas, regions, and strategies, strengthening key message delivery in company overview, business introduction, and strategy presentations.
-
How to Use
Enter business domain names, strategy items, and core competencies in the six boxes surrounding the central globe. Edit title and description text in each box to express global business structure, and modify colors to distinguish priorities and categories. Add animations aligned with presentation flow to create dynamic effects.
-
Recommended For
Ideal for global company business introductions, multinational project explanations, and business expansion plan sharing. Effectively communicates business scope and strategic direction to executives, investors, and partner companies. Also suitable for marketing and sales team business domain explanation materials.
-
Slide Structure
A teal-colored central globe element is positioned at the center, surrounded by six arrow boxes arranged in four cardinal directions and two diagonal directions. Each box consists of a title section (colored top bar) and description text input area, with colors differentiated in red, gray, and teal to represent information hierarchy.
Related Products
-

Business Infrastructure Connectivity Diagram – Visualizing Strategic Business Areas
#Business Introduction #Diagram #Business Areas
-

Healthcare Business Infrastructure Diagram – Visualizing Business Areas
#Business Introduction #Diagram #Business Areas
-

Science Experimental Area Diffusion Diagram – Connecting Innovative Ideas
#Business Introduction #Diagram #Business Areas
-

Business Infrastructure Pentagon Diagram – Effective Business Presentation
#Business Introduction #Diagram #Business Areas
