SWOT Analysis Split Diagram - Effective Tool for Market Analysis
RM0500005_17
- Last Update 02/21/2025
- File Size 0.2MB
- # of Slides 2
- File Format PPTX
- Slide Ratio 16:9
- Color
Keywords
- #Content-Based Slides
- #Design-Based Slides
- #Market and Competitor Analysis
- #Diagram
- #SWOT Analysis
- #Market Analysis
- #Cluster
- #Closed Cluster Diagram
- #16:9
- #SWOT analysis diagram
- #SWOT analysis PowerPoint slide
- #4-section diagram template
- #market analysis PPT
- #competitive analysis slide
- #SWOT template download
About the Product
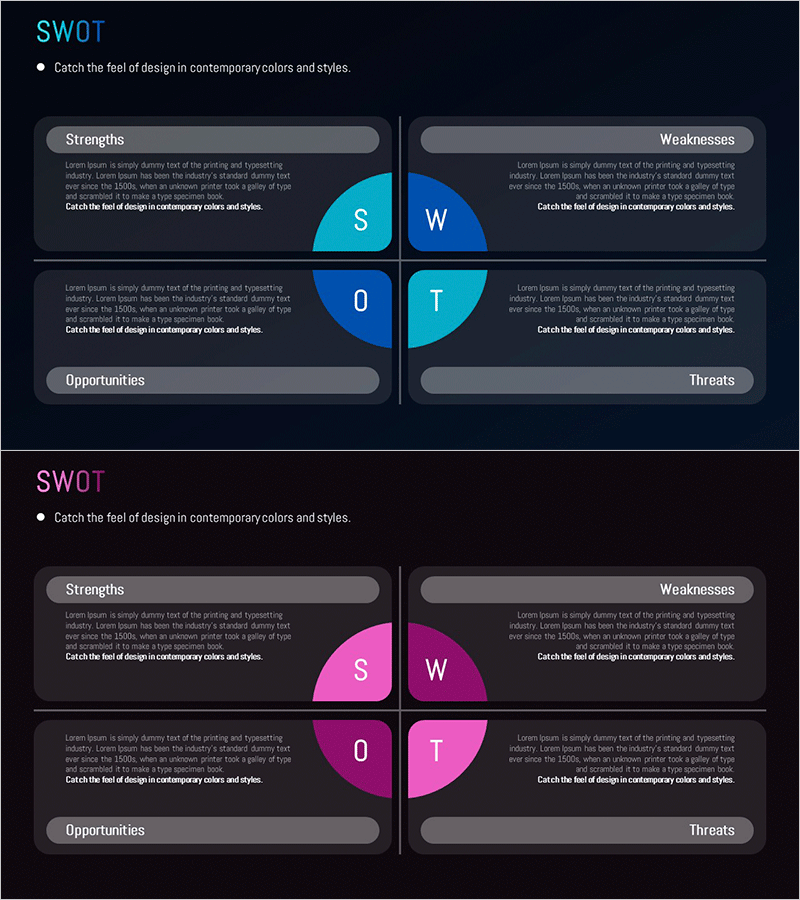
An essential SWOT analysis diagram PowerPoint slide for market analysis and competitive assessment. This presentation template clearly divides Strengths, Weaknesses, Opportunities, and Threats into four distinct sections, with dedicated text input areas for each quadrant. The cyan and blue dual-tone color scheme creates a contemporary and professional atmosphere, presented in 16:9 widescreen format across 2 slides. This PowerPoint slide is ready to use immediately in business strategy presentations, marketing planning documents, management reports, and strategic planning sessions.
Usage Points
-
Main Usage
A strategic analysis tool that systematically visualizes a company's strengths and weaknesses alongside market opportunities and threats. It supports decision-making during strategy development by evaluating internal capabilities and external environment simultaneously, while fostering shared understanding among executives and team members.
-
How to Use
Fill in relevant items for each quadrant (S, W, O, T) in the designated text input areas to document your analysis findings. Use this slide in business strategy presentations, marketing planning meetings, management reports, investor pitch decks, or print it as a workshop reference material for strategic planning sessions.
-
Recommended For
Ideal for executives, strategic planning teams, marketing managers, business development professionals, management consultants, and educators conducting business strategy development, market entry planning, competitive analysis, and organizational assessments.
-
Slide Structure
Comprises 2 slides with a circular diagram centered on each slide, divided into 4 quadrants. Cyan S (top-left), blue W (top-right), blue O (bottom-left), and cyan T (bottom-right) sections are symmetrically arranged, with text input boxes positioned to the right of each quadrant for content entry.
Related Products
-

SWOT Analysis Closed Circle Diagram – Market and Competitor Analysis
#Market and Competitor Analysis #Diagram #SWOT Analysis
-

SWOT Analysis Closed Diagram – Enhancing Market and Competitor Understanding
#Market and Competitor Analysis #Diagram #SWOT Analysis
-

SWOT Analysis List Slide – Innovative Visualization
#Market and Competitor Analysis #Diagram #SWOT Analysis
-

4-Quarter SWOT Analysis Diagram – Effective Strategy Decision Making
#Market and Competitor Analysis #Diagram #SWOT Analysis
