Diagram Slide Visualizing Competitive Technologies of Construction Companies
RM0500004_14
- Last Update 02/20/2025
- File Size 3MB
- # of Slides 2
- File Format PPTX
- Slide Ratio 16:9
- Color
Keywords
- #Content-Based Slides
- #Design-Based Slides
- #Business Introduction
- #Market and Competitor Analysis
- #Diagram
- #Technological Status
- #Competitive Advantage
- #Flow
- #Linear Flow
- #16:9
- #technology competitiveness diagram PowerPoint
- #construction company technology analysis slide
- #competitive technology presentation
- #technology status visualization PPT
- #diagram slide template
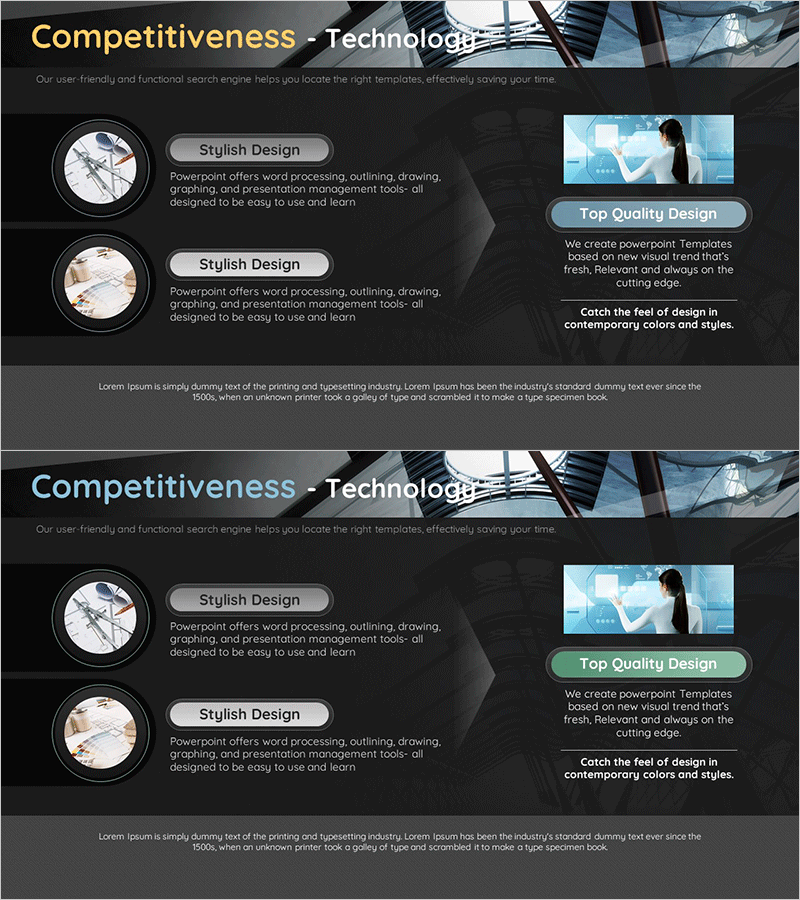
About the Product
A 2-slide PowerPoint presentation visualizing the technology competitiveness of construction companies. Features a linear diagram with circular image placeholders and text boxes on a dark background, designed to present technology analysis, competitive technology comparison, and technology status reports. Each slide is optimized for construction industry presentations, technical reports, and executive briefings. Provided in 16:9 widescreen PPTX format with fully editable text and image areas for seamless customization.
Usage Points
-
Main Usage
Clearly presents construction company technology competitiveness and status through a structured 2-stage linear diagram. The combination of circular image areas and text boxes organizes technical analysis content to enhance audience comprehension and effectively communicate key information during technology competitiveness comparisons and strategic planning.
-
How to Use
Insert into technology analysis sections, competitive technology comparison pages, and technology status explanation slides. Enter technology names, characteristics, and competitiveness metrics in each stage's text boxes, and add technology-related photos or icons to the circular image areas to strengthen visual impact.
-
Recommended For
Recommended for construction company executives, technology managers, business development teams, and investor relations professionals presenting technology competitiveness. Suitable for technical reports, executive briefings, technology strategy presentations, investor pitch decks, and technology seminars.
-
Slide Structure
2-slide composition with symmetric linear layout: left side features 2 circular image placeholders (top and bottom), right side contains 2 text boxes (top and bottom). Dark background with light blue accent buttons and gray text boxes present technology information in sequential stages, optimized for 16:9 widescreen format.
Related Products
-

Chemical Process Diagram – Flow and Visual Appeal
#Business Introduction #Diagram #Business Areas
-

Solar System Illustration Diagram – Visual Aid for Market Analysis
#Business Introduction #Market and Competitor Analysis #Diagram
-

Interplanetary Competitive Advantage Diagram – Competitive Analysis in Space
#Market and Competitor Analysis #Diagram #Competitive Advantage
-

Blue Green Tone Flow Linear Diagram
#Market and Competitor Analysis #Diagram #Competitive Advantage
