Table of Key Fund Management Calculations – Practicality and Clarity
RM0500003_28
- Last Update 02/20/2025
- File Size 0.7MB
- # of Slides 2
- File Format PPTX
- Slide Ratio 16:9
- Color
Keywords
- #Content-Based Slides
- #Design-Based Slides
- #Company Introduction
- #Financial Plans and Performance
- #Diagram
- #Business Areas
- #Capital Requirements
- #16:9
- #fund management PowerPoint slide
- #financial data table slide
- #budget calculation PPT
- #investment pitch deck funds
- #business plan fund allocation slide
About the Product
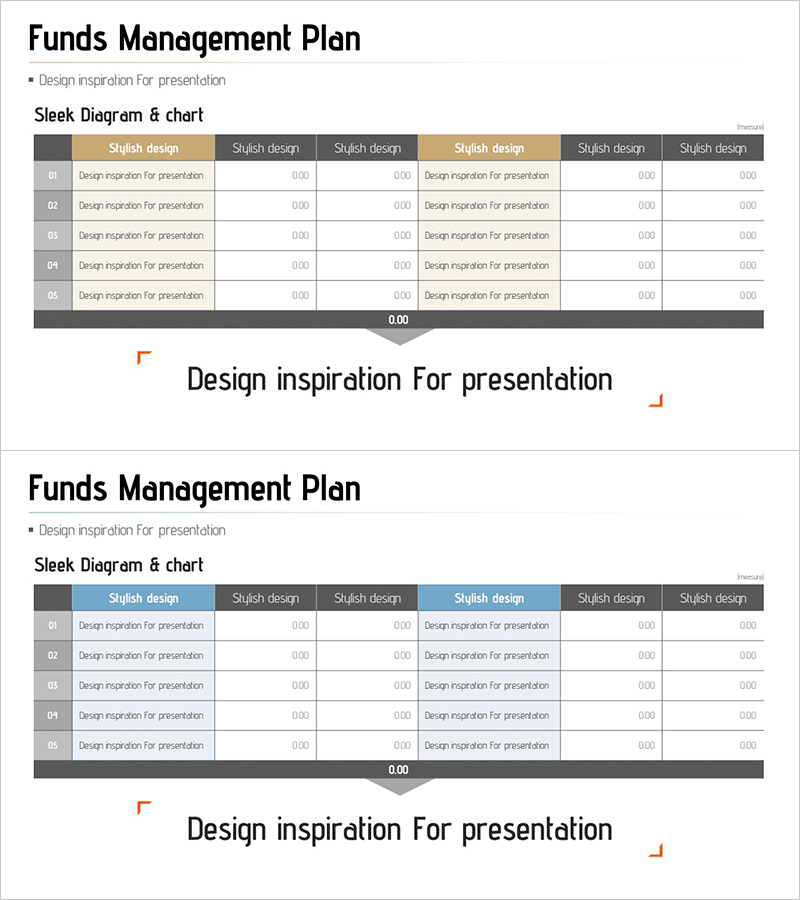
A financial data table PowerPoint slide designed to clearly present fund allocation and budget management in business plans and investor pitch decks. The slide features a structured layout with beige, gray, and blue header tones and five rows for data entry, allowing you to organize required funds, investment returns, and budget items systematically. Each cell accommodates numerical values and descriptions, enabling you to demonstrate financial planning credibility to investors and stakeholders. Optimized for 16:9 widescreen format, this slide is ideal for projector presentations. Provided in editable PPTX format, it effectively visualizes your organization's fund management strategy and financial projections.
Usage Points
-
Main Usage
Present required funds, investment returns, and budget allocations in business plans and investor pitch decks. The structured table format helps demonstrate financial planning credibility and execution feasibility to investors and stakeholders, making complex financial data accessible and persuasive.
-
How to Use
Enter fund category names in the six column headers and input corresponding numerical values and descriptions in the five data rows. The color-coded headers clarify information hierarchy, while the total row at the bottom emphasizes overall fund requirements. During presentations, explain each line item to enhance investor understanding and confidence.
-
Recommended For
Startup and SME business plan development, venture capital fundraising presentations, bank loan applications, government grant proposals, shareholder meetings, executive financial reports, and management meetings discussing fund allocation and cash flow projections.
-
Slide Structure
Two-slide set featuring identical table structures in different color schemes. Each slide contains a title area, six column headers, five data entry rows, and a total calculation row. The first slide uses beige and gray tones, while the second employs blue accents, providing design flexibility for different presentation contexts.
Related Products
-

Cash Management Plan Circular Diagram – Efficient Fund Flow
#Company Introduction #Financial Plans and Performance #Diagram
-

Medical Business Finance Management Plan – Efficiency and Systematization
#Company Introduction #Financial Plans and Performance #Diagram
-

Transparent Fund Management System Slide
#Company Introduction #Financial Plans and Performance #Diagram
-

Hexagonal Diffusion Diagram for Business Area Visualization
#Company Introduction #Business Introduction #Diagram
