Transparent Fund Management System Slide
RM0500002_28
- Last Update 02/20/2025
- File Size 1.1MB
- # of Slides 2
- File Format PPTX
- Slide Ratio 16:9
- Color
Keywords
- #Content-Based Slides
- #Design-Based Slides
- #Company Introduction
- #Financial Plans and Performance
- #Diagram
- #Business Areas
- #Capital Requirements
- #Cluster
- #Chain Diagram
- #16:9
- #connected diagram PowerPoint
- #fund management slide
- #4-stage process diagram
- #financial planning template
- #transparent reporting system PowerPoint
About the Product
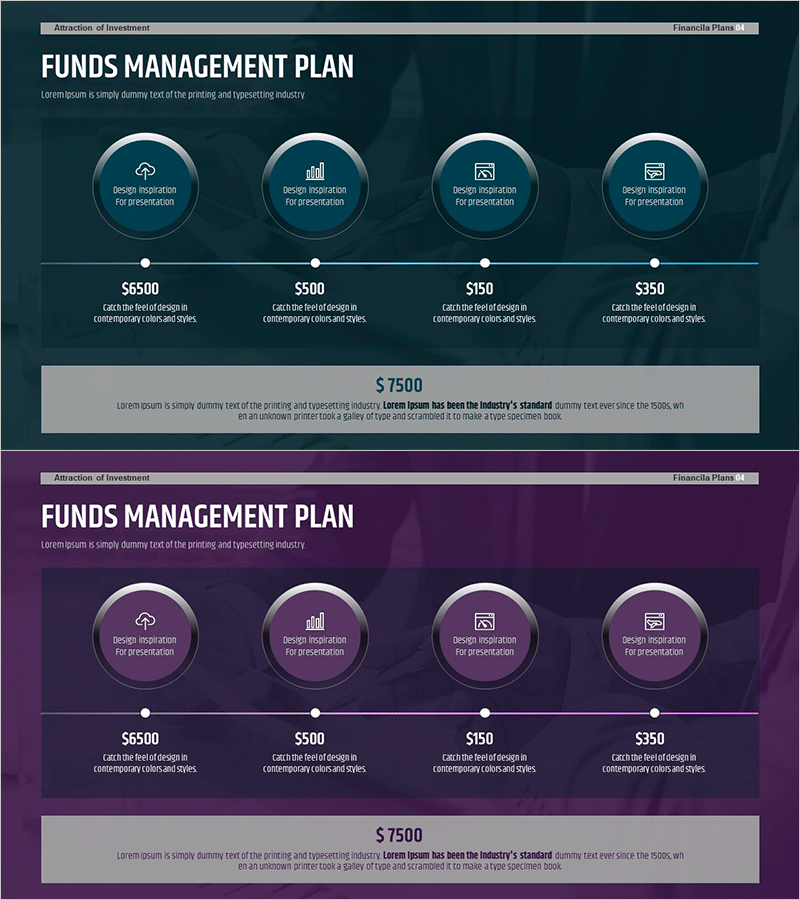
A 4-stage connected diagram PowerPoint slide that visualizes fund management transparency and financial planning processes. Featuring circular nodes arranged horizontally with connecting lines on a dark teal background, this presentation template clearly illustrates each stage of fund flow and transparent reporting systems. Ideal for investment pitches, financial planning presentations, and fund requirement discussions. The 2-slide deck in 16:9 format is fully editable and ready to customize with your fund allocation data.
Usage Points
-
Main Usage
Communicate fund management processes and transparent reporting systems through visual stage-by-stage flow. The circular node design with horizontal connectors clearly demonstrates fund allocation transparency to investors, stakeholders, and team members, making complex financial structures easy to understand.
-
How to Use
Use in financial planning presentations, investor pitch decks, fund management policy briefings, and internal reporting meetings. Edit each node with stage names (e.g., Fund Sourcing, Allocation, Operations, Reporting) and update the amount figures below to reflect your actual fund distribution.
-
Recommended For
CFOs, finance teams, investment managers, and executives presenting fund management transparency. Perfect for startup fundraising pitches, corporate financial disclosures, fund management company presentations, and government grant applications.
-
Slide Structure
2-slide deck with dark teal and purple color variants. Each slide features 4 circular nodes arranged horizontally with connecting lines. Fund amounts ($6500, $500, $150, $350) appear below each node, with total amount ($7500) and descriptive text at the bottom. Both slides maintain identical structure for consistent visual messaging.
Related Products
-

Mobile App Service Sector Diagram – Visualizing Business Components
#Company Introduction #Technical Approach #Diagram
-

3D Cylinder Shape Diagram – Business Strategy and Vision
#Company Introduction #Business Vision and Strategy #Diagram
-

Business Strategy Presentation Using Triangle Diagram
#Company Introduction #Business Vision and Strategy #Diagram
-

Internet of Things Service Area Diagram – Business Introduction and Visualization
#Company Introduction #Business Introduction #Diagram
