Visualizing R&D Investment and Performance – Future of Innovation
RM0500002_14
- Last Update 02/20/2025
- File Size 3.6MB
- # of Slides 2
- File Format PPTX
- Slide Ratio 16:9
- Color
Keywords
- #Content-Based Slides
- #Design-Based Slides
- #Business Introduction
- #Technical Approach
- #Diagram
- #Technological Status
- #Innovative Technologies and Future Plans
- #Flow
- #Cluster
- #Linear Flow
- #Closed Cluster Diagram
- #16:9
- #closed-loop circular diagram PowerPoint
- #R&D investment slide template
- #3-stage process diagram
- #technology innovation presentation
- #research performance visualization
- #circular flow chart PowerPoint download
About the Product
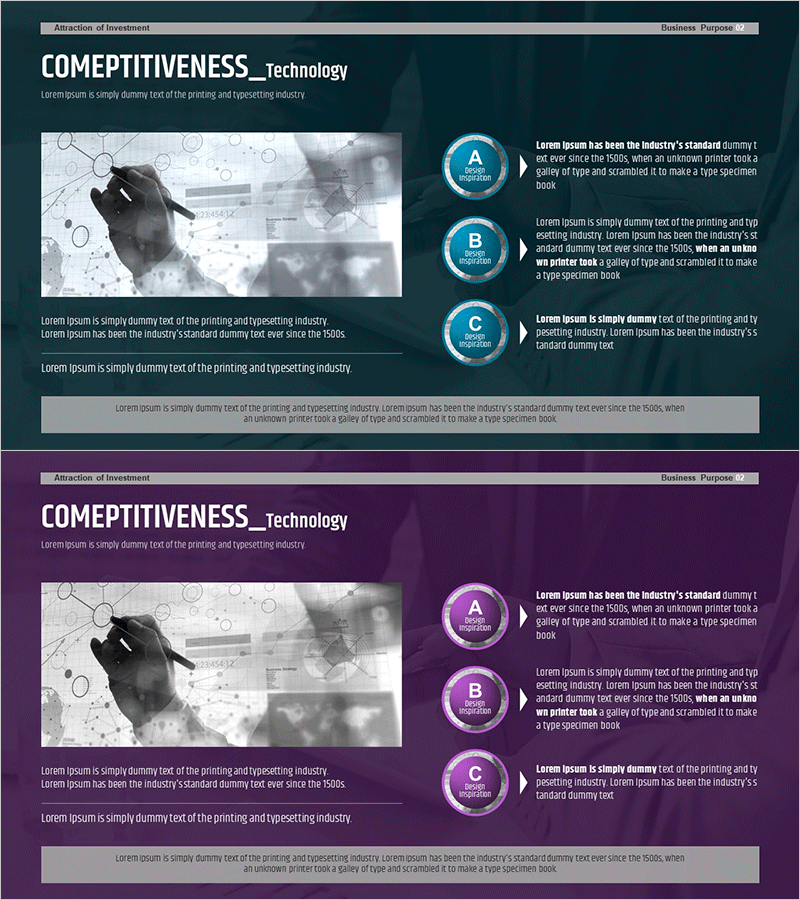
A closed-loop circular diagram PowerPoint slide designed to visualize R&D investment and performance outcomes. The design features a central core concept connected to three surrounding circular nodes, enabling step-by-step representation of research and development stages. Set against a dark teal background with bright blue circular buttons and white typography, it conveys technical expertise and innovation focus. The 2-slide set includes color variations (teal and purple themes), with each node offering editable text fields and icon placeholders. Ideal for research presentations, investment pitches, technology strategy briefings, and corporate innovation showcases.
Usage Points
-
Main Usage
Presents R&D investment stages and outcomes using a centralized circular structure that clearly communicates the flow of technological innovation. Effectively visualizes complex research processes for investment presentations, performance reports, and technology strategy briefings by transforming abstract concepts into intuitive visual relationships.
-
How to Use
Input investment stage names (basic research, applied research, commercialization) and performance metrics into each circular node. Place the core objective or innovation theme in the central circle, with supporting details in the three surrounding nodes. Customize icons and adjust colors to align with corporate branding and presentation themes.
-
Recommended For
R&D managers, executive officers leading investment initiatives, research institute directors, technology strategy planners, and science educators. Suitable for investor presentations, technology conferences, research outcome reports, and corporate innovation strategy communications.
-
Slide Structure
2-slide set, each featuring a central circular node connected to three surrounding circular nodes in a closed-loop configuration. Slide 1 uses dark teal background with blue circular buttons; Slide 2 features purple background with purple circular buttons. All nodes include independently editable text boxes and icon placeholder areas for customization.
Related Products
-

Medical Business Step-by-Step Schedule Planning – Innovative Technology
#Business Introduction #Technical Approach #Diagram
-

Business Strategy Flow System – Innovation and Growth
#Technical Approach #Diagram #Future Development Roadmap
-

Diagram Slide Visualizing Donation Event Procedures
#Business Introduction #Business Strategy #Diagram
-

Core Technology and Research and Development Strategy | Innovation Insights
#Business Introduction #Technical Approach #Diagram
