Campaign Activity Monitoring – Diagram for Marketing Strategy Management
RM0400016_11
- Last Update 02/19/2025
- File Size 1.7MB
- # of Slides 2
- File Format PPTX
- Slide Ratio 16:9
- Color
Keywords
- #Content-Based Slides
- #Design-Based Slides
- #Marketing Plan and Strategy
- #Diagram
- #Marketing Strategy
- #Key Marketing Activities
- #Flow
- #Cluster
- #Linear Flow
- #Closed Cluster Diagram
- #16:9
- #closed cluster diagram PowerPoint
- #campaign activity monitoring slide
- #marketing strategy diagram PowerPoint
- #how to create cluster diagram in PowerPoint
- #activity management presentation template
About the Product
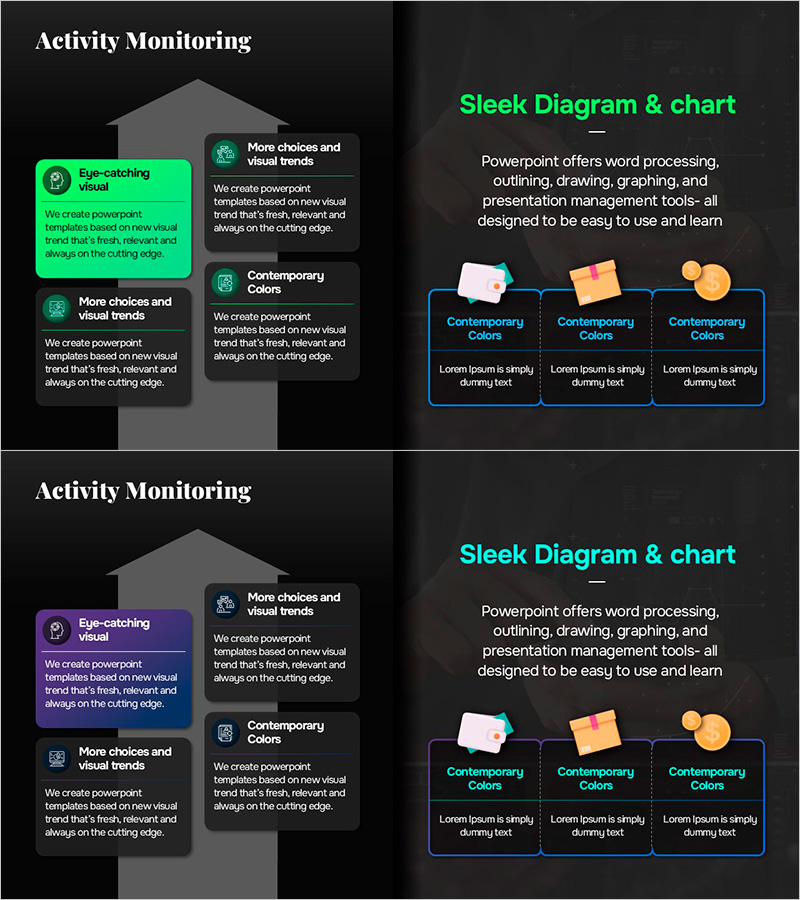
A closed cluster diagram PowerPoint slide designed for visualizing campaign activity monitoring and marketing strategy management. The structure features a central hub concept (Activity Monitoring) with surrounding connected elements, enabling clear presentation of multiple campaign activities and initiatives. Neon green and purple accent colors stand out against the dark background, with dedicated text areas for detailed descriptions beneath each element. This 16:9 aspect ratio, 2-slide PPTX template is ready for immediate use in presentations and reports.
Usage Points
-
Main Usage
Organizes and visualizes multiple campaign activities around a central concept, making it ideal for marketing strategy presentations, campaign status reports, and project management communications. Helps stakeholders quickly understand the relationships between different campaign components.
-
How to Use
Enter the core concept in the central node and add specific activities and descriptions in the surrounding boxes. Edit text areas to reflect actual campaign data and customize colors to match your organization's branding guidelines.
-
Recommended For
Marketing managers, campaign planners, and strategy professionals presenting campaign activity status. Suitable for marketing strategy meetings, executive briefings, and team collaboration sessions.
-
Slide Structure
Two-slide set featuring a closed cluster layout with one central circular node and 4-5 connected surrounding boxes per slide. Neon green and purple accent boxes create visual hierarchy against the dark background, with descriptive text areas positioned below each element for detailed information.
Related Products
-

Marketing Activities Slides – Effective Strategies and Visual Appeal
#Marketing Plan and Strategy #Diagram #Marketing Strategy
-

Traditional Culture Marketing Strategy Diagram – Flow and Cluster
#Business Strategy #Marketing Plan and Strategy #Diagram
-

Real Estate Brokerage Diagram for Marketing Strategy Visualization
#Business Management #Marketing Plan and Strategy #Diagram
-

Presentation Slide for Differentiated Marketing Launch Strategy
#Business Vision and Strategy #Marketing Plan and Strategy #Diagram
