Market Segmentation Diagram by Industry
RM0400014_7
- Last Update 02/19/2025
- File Size 0.3MB
- # of Slides 2
- File Format PPTX
- Slide Ratio 16:9
- Color
Keywords
- #Content-Based Slides
- #Design-Based Slides
- #Business Introduction
- #Market and Competitor Analysis
- #Diagram
- #Business Areas
- #Market Overview
- #Cluster
- #Spread
- #Chain Diagram
- #Radial Diagram
- #16:9
- #radial diagram PowerPoint
- #market segmentation presentation
- #industry analysis slide template
- #business diagram PPT
- #competitive analysis slide
About the Product
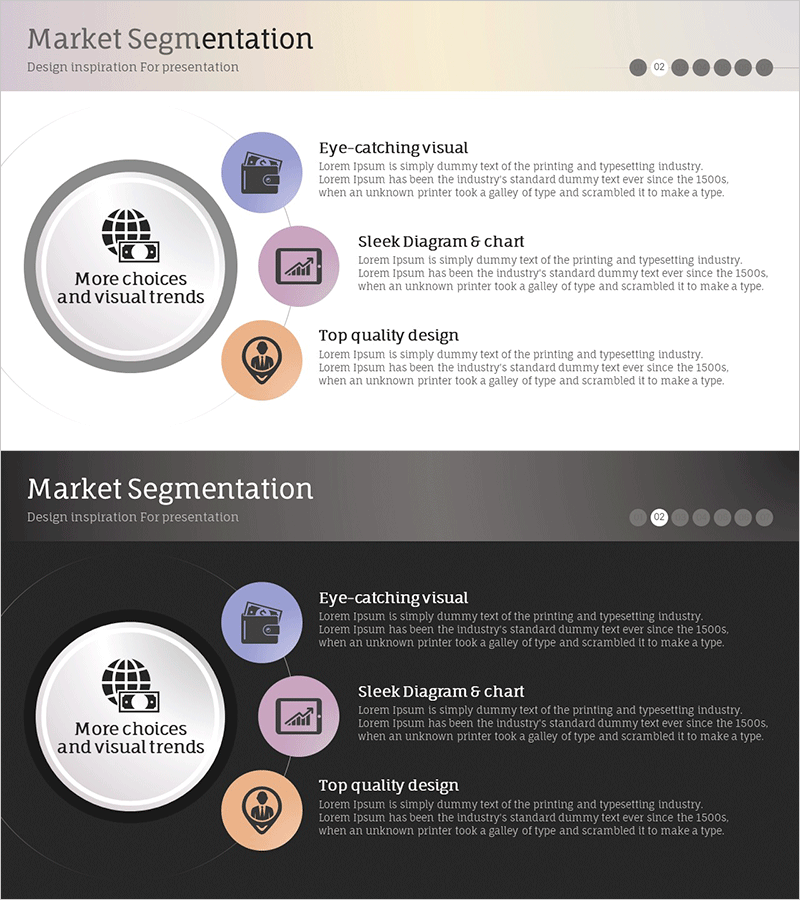
A radial diagram PowerPoint slide that expands from a central concept into three industry segments. This presentation template is ideal for business strategy presentations including market segmentation, industry analysis, and competitive analysis. The design features a light beige background with a gray circular frame and three colored circular icons (blue, pink, orange) with dedicated text description areas for each segment. A dark background version is also included for flexible presentation environments. The 2-slide set is available in 16:9 widescreen PPTX format for immediate editing and customization.
Usage Points
-
Main Usage
Visually communicate corporate market segmentation strategies, customer classification by industry, and competitive analysis. The radial structure clearly conveys the relationship between core concepts and detailed segments, making complex market data easily understandable.
-
How to Use
Enter your core concept (e.g., Market Segmentation) in the central circular frame, then add segment names and descriptions to the three surrounding circular icons. Colors and icons can be customized to match your industry, and choose between light or dark background versions based on your presentation environment.
-
Recommended For
Marketing professionals, strategic planning teams, and sales executives presenting market analysis results. Particularly effective for new business expansion plans, customer segmentation strategies, and competitive landscape analysis in executive decision-making presentations.
-
Slide Structure
2-slide set. Slide 1: Light beige background with central circular frame and 3-division radial diagram featuring blue, pink, and orange circular icons with adjacent title and description text areas. Slide 2: Identical structure with dark gray background for alternative presentation settings.
Related Products
-

Marketing Commercialization Connection Diagram – Business Scope and Strategy
#Business Introduction #Marketing Plan and Strategy #Diagram
-

Business Sector Structure Hexagon Diagram – Visual Trend Introduction
#Company Introduction #Business Introduction #Diagram
-

Diagram of Gaming Device Types – Business Vision and Diversity
#Company Introduction #Business Introduction #Diagram
-

Global Transportation Network Structure – Cluster Diagram
#Company Introduction #Business Introduction #Diagram
