Business Sector Structure Hexagon Diagram – Visual Trend Introduction
RM0300005_13
- Last Update 02/08/2025
- File Size 1.6MB
- # of Slides 2
- File Format PPTX
- Slide Ratio 16:9
- Color
Keywords
- #Content-Based Slides
- #Design-Based Slides
- #Company Introduction
- #Business Introduction
- #Diagram
- #Business Areas
- #Business Areas
- #Cluster
- #Spread
- #Chain Diagram
- #Radial Diagram
- #16:9
- #radial diagram PowerPoint
- #hexagon diagram slide template
- #business structure presentation
- #center-point diagram
- #how to create radial diagram in PowerPoint
About the Product
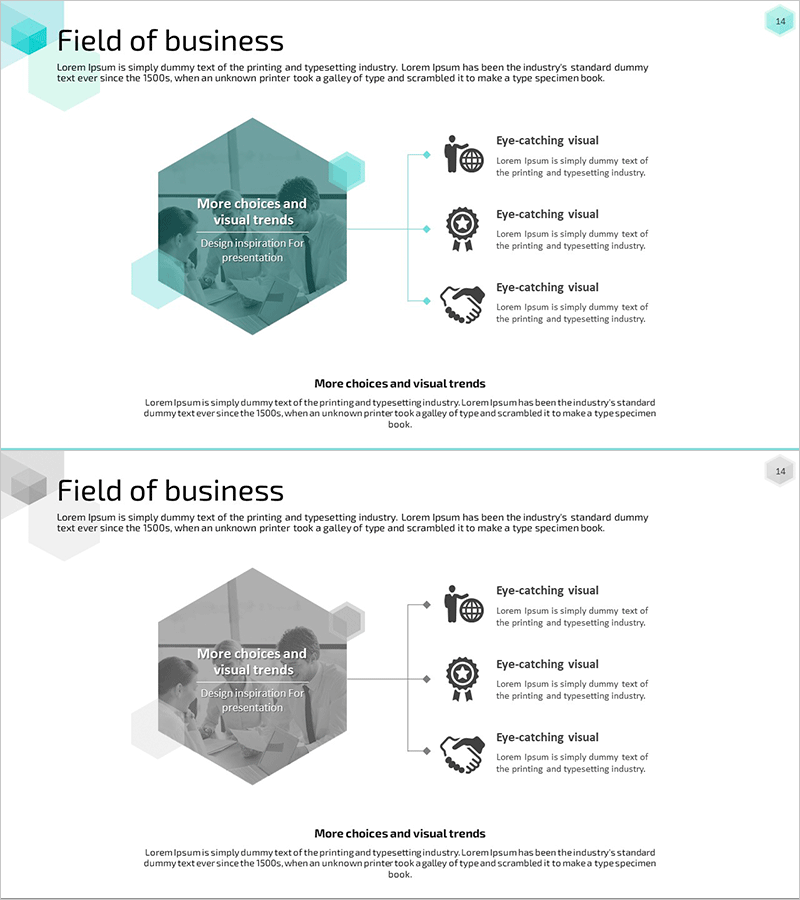
A PowerPoint slide featuring a radial diagram that visualizes business sector structure through a central hexagon extending to three directional items. The teal-colored background hexagon contains the core message, with three icon-linked items (global, technology, partnership) positioned to the right and connected by lines. The 2-slide set includes a color version and grayscale version, optimized for 16:9 widescreen presentations. This presentation template is ready to use for business trend introductions, organizational role distribution, strategic direction presentations, and various corporate communication scenarios.
Usage Points
-
Main Usage
Visualizes business sector structure, organizational roles, and strategic direction by radiating from a central hexagon outward to three supporting elements. The core concept anchors the center while three detailed items with icons branch outward, clearly expressing hierarchical relationships and interconnections.
-
How to Use
Ideal for company vision presentations, business domain introductions, organizational structure explanations, strategic planning reports, and marketing strategy presentations. Simply edit the central text and three surrounding items with your content for immediate use in professional presentations.
-
Recommended For
Recommended for executives, business planners, marketing professionals, organizational development specialists, and strategy teams explaining organizational structure, business domains, and strategic direction. Particularly effective when communicating complex business structures in a simple, intuitive manner.
-
Slide Structure
2-slide set: Slide 1 features a teal-background hexagon diagram with three connected icons (global, technology, partnership); Slide 2 provides the same structure in grayscale. 16:9 widescreen format, PPTX file with fully editable elements.
Related Products
-

Business Area Diffusion Diagram – Directions for Business Development
#Company Introduction #Business Introduction #Diagram
-

Global Transportation Network Structure – Cluster Diagram
#Company Introduction #Business Introduction #Diagram
-

Fountain Pen Business Area Diagram – Visualized Cluster Structure
#Company Introduction #Business Introduction #Diagram
-

Diagram of Gaming Device Types – Business Vision and Diversity
#Company Introduction #Business Introduction #Diagram
