Quarterly Marketing Operations Plan Table – Optimized for Business Strategy
RM0400014_29
- Last Update 02/19/2025
- File Size 0.2MB
- # of Slides 2
- File Format PPTX
- Slide Ratio 16:9
- Color
Keywords
About the Product
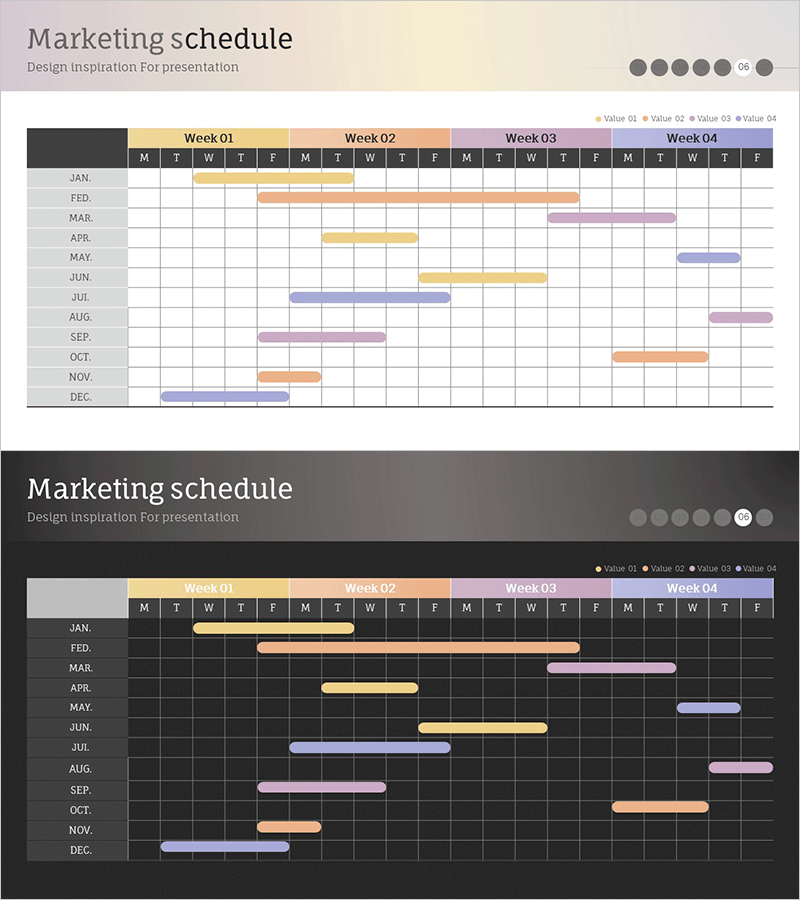
A Gantt chart-style PowerPoint slide for visualizing marketing operations and campaign timelines. Available in two design versions: light beige background and dark gray background. The slide displays a 12-month annual schedule broken down by weeks (Week 01–04) and days (M, T, W, T, F). Four distinct colors—yellow, orange, purple, and blue—differentiate marketing campaigns, projects, and events for quick visual reference. Months (JAN–DEC) are arranged vertically on the left, with weekly columns across the top for precise scheduling. Ideal for business strategy presentations, marketing operations planning, project timeline management, and quarterly campaign coordination. Fully editable and ready for immediate use in professional presentations.
Usage Points
-
Main Usage
Displays annual marketing operations and campaign timelines in a single, easy-to-understand visual format. The Gantt chart structure enables teams to track monthly and weekly schedules, monitor project progress, and align stakeholders on campaign deadlines. Essential for executive briefings, team coordination, and partner communication.
-
How to Use
Use this slide in marketing strategy presentations, quarterly operations reports, and campaign timeline briefings. Double-click the colored bars to edit text and adjust schedules. Choose between the light beige or dark gray background version based on your presentation environment and corporate branding guidelines.
-
Recommended For
Marketing managers, marketing coordinators, business planners, project managers, and executives preparing operational reports. Ideal for quarterly marketing planning, annual campaign roadmaps, project schedule management, and cross-functional team coordination meetings.
-
Slide Structure
The slide features a table layout with 12 months (JAN–DEC) as rows on the left and weekly columns (Week 01–04 with M, T, W, T, F days) across the top. Colored bars in each cell represent different campaigns, projects, or events. Two versions provided: light beige and dark gray backgrounds for flexible presentation contexts.
Related Products
-

Business Problem Resolution Plan Schedule – Strategic Approach
#Business Strategy #Operational Plan #Diagram
-

Business Promotion Schedule – Roadmap for Business Strategy
#Business Strategy #Operational Plan #Diagram
-

Calendar Illustration Table – Visualizing Business Strategy
#Business Strategy #Business Management #Diagram
-

Business Development Schedule – Roadmap for Project Strategy
#Business Strategy #Diagram #Roadmap
