September Schedule Roadmap – Business Strategy and Planning
RJ0300096_12
- Last Update 05/16/2025
- File Size 1.2MB
- # of Slides 2
- File Format PPTX
- Slide Ratio 16:9
- Color
Keywords
- #Content-Based Slides
- #Design-Based Slides
- #Business Strategy
- #Operational Plan
- #Diagram
- #Other
- #Roadmap
- #Project Implementation Schedule
- #Table
- #Mockup
- #16:9
- #September schedule roadmap PowerPoint
- #timeline roadmap slide
- #business planning timeline PPT
- #monthly operational plan slide
- #how to create a roadmap in PowerPoint
About the Product
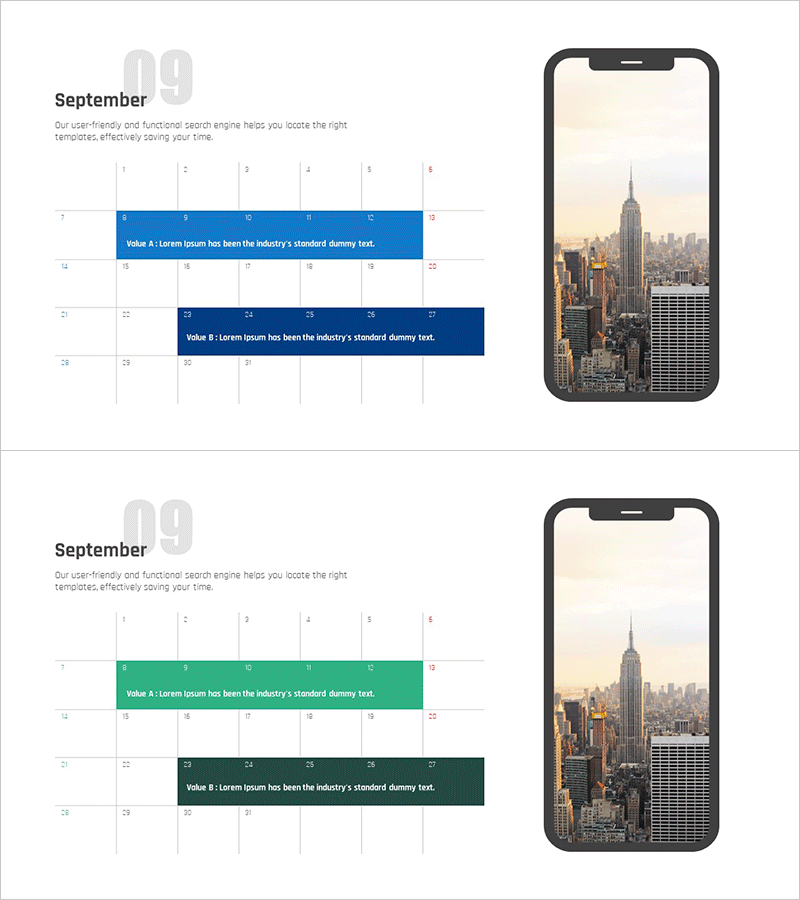
A horizontal timeline roadmap PowerPoint slide that visualizes business execution strategy and monthly operational planning. Composed of 2 slides with distinct color schemes—the first uses a blue gradient for September scheduling, while the second employs a green gradient to enable comparative analysis. Each slide features 2 primary timeline bars labeled Value A and Value B, positioned over a full-month date grid (1–31) for precise scheduling. A New York skyline photograph on the right side adds visual credibility to your presentation. Designed in 16:9 widescreen format for modern presentation environments and delivered as fully editable PPTX, allowing immediate customization of dates, labels, and color accents.
Usage Points
-
Main Usage
Communicate monthly business schedules and execution strategies using a clear horizontal timeline format. The dual color scheme (blue and green) allows you to represent different business initiatives or comparative planning scenarios, with each bar indicating the start and end points of key activities.
-
How to Use
Ideal for business plans, quarterly operational planning presentations, and strategy meetings. Simply replace the Value A and Value B labels with your project or initiative names, adjust the bar lengths according to the date grid, and modify colors to distinguish between departments or project phases. The date grid serves as a reference for precise timeline alignment.
-
Recommended For
Executives, business managers, and project coordinators presenting monthly progress reports and future planning. Particularly effective for organizations managing multiple concurrent projects, visualizing schedule conflicts, or explaining quarterly milestone achievement plans to stakeholders.
-
Slide Structure
Both slides follow an identical layout: left section displays the month label (September) with descriptive text, center area contains a full-month date grid (1–31) with 2 horizontal timeline bars (Value A and Value B), and right section features a cityscape photograph. Color differentiation—blue for slide 1, green for slide 2—enables visual comparison.
Related Products
-

August Roadmap Diagram – Business Strategy
#Business Strategy #Operational Plan #Diagram
-

Space Rocket Roadmap Slide – Business Strategy and Operation Plan
#Business Strategy #Operational Plan #Diagram
-

Yearly Goal Setting Chart – Visualizing Business Strategy
#Business Strategy #Operational Plan #Diagram
-

Big Data Development Schedule to Formulate Business Strategy
#Business Strategy #Operational Plan #Diagram
