Brand Marketing Execution Plan – Effective Strategy Roadmap
RM0400012_29
- Last Update 02/18/2025
- File Size 1MB
- # of Slides 2
- File Format PPTX
- Slide Ratio 16:9
- Color
Keywords
About the Product
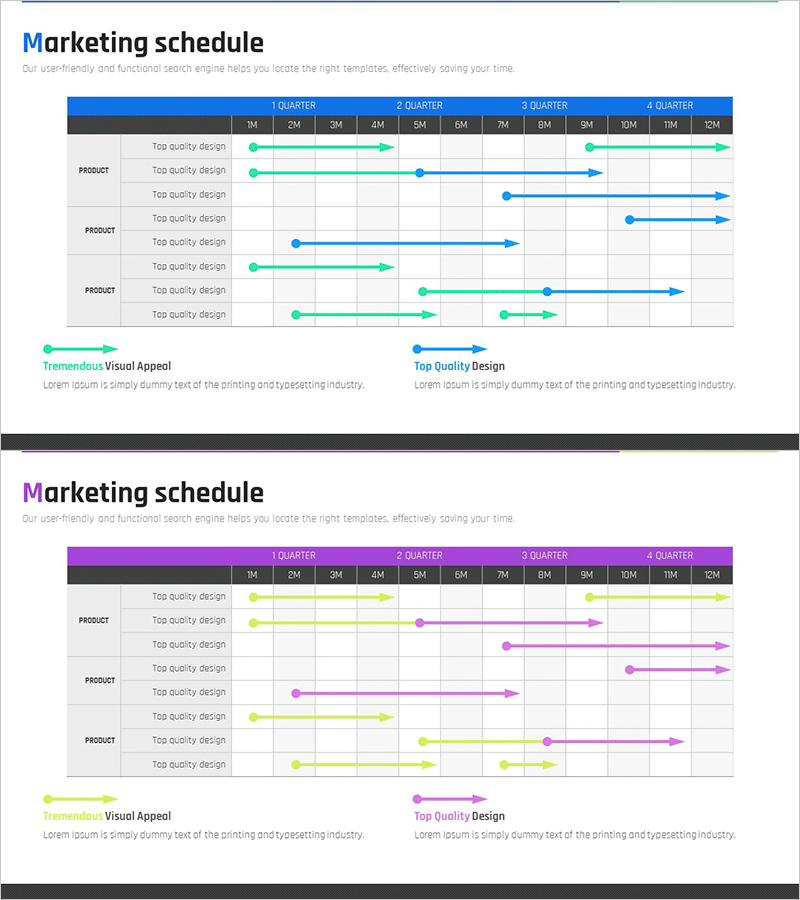
A PowerPoint slide that visualizes quarterly marketing execution plans with a clear timeline structure. Blue and green arrows represent different product lines and their marketing schedules across 12 months, making it easy to distinguish phases and track monthly milestones. This 2-slide presentation is optimized for 16:9 widescreen format and allows full customization of text and colors. Ideal for marketing strategy presentations, business planning sessions, team coordination meetings, and executive reporting on campaign timelines.
Usage Points
-
Main Usage
Visualizes marketing execution plans by quarter and month, enabling teams to share timelines and track progress collectively. By clearly marking start and end dates for each product's marketing activities, it supports project management and strategic decision-making across the organization.
-
How to Use
Use this slide in marketing plans, business proposals, and quarterly strategy presentations as the execution timeline section. Input marketing campaign dates for each product line and use color coding to distinguish priorities or categories. Effective for executive briefings, team meetings, and client presentations where demonstrating plan feasibility is critical.
-
Recommended For
Marketing managers, product managers, business planning teams, and executives responsible for strategy reporting. Particularly valuable for quarterly budget allocation, campaign scheduling, and multi-product portfolio management. Applicable across organizations of all sizes, from startups to enterprises.
-
Slide Structure
The first slide displays 4 quarters (1Q–4Q) as headers with monthly intervals (1M–12M) as detailed columns. Three product lines are represented as separate rows, each with blue and green arrows indicating scheduled periods. The second slide includes a legend and explanation area for documenting marketing activity rationale and expected outcomes.
Related Products
-

Business Promotion Schedule – Roadmap for Business Strategy
#Business Strategy #Operational Plan #Diagram
-

Black Theme Business Roadmap – Efficient Business Strategy
#Business Strategy #Operational Plan #Diagram
-

Effective Business Strategy with Yearly Calendar Schedule
#Business Strategy #Operational Plan #Diagram
-

Business Schedule Planning & Description – Diagram for Business Strategy
#Business Strategy #Business Management #Diagram
