Annual Marketing Budget Analysis Chart - Visualizing Financial Performance
RM0400012_26
- Last Update 02/18/2025
- File Size 1MB
- # of Slides 2
- File Format PPTX
- Slide Ratio 16:9
- Color
Keywords
- #Content-Based Slides
- #Design-Based Slides
- #Financial Plans and Performance
- #Diagram
- #Graph
- #Income Statement
- #Budget
- #Table
- #Circles
- #Pie Chart
- #16:9
- #pie chart PowerPoint
- #marketing budget analysis slide
- #budget allocation visualization
- #financial performance chart
- #how to create pie chart in PowerPoint
About the Product
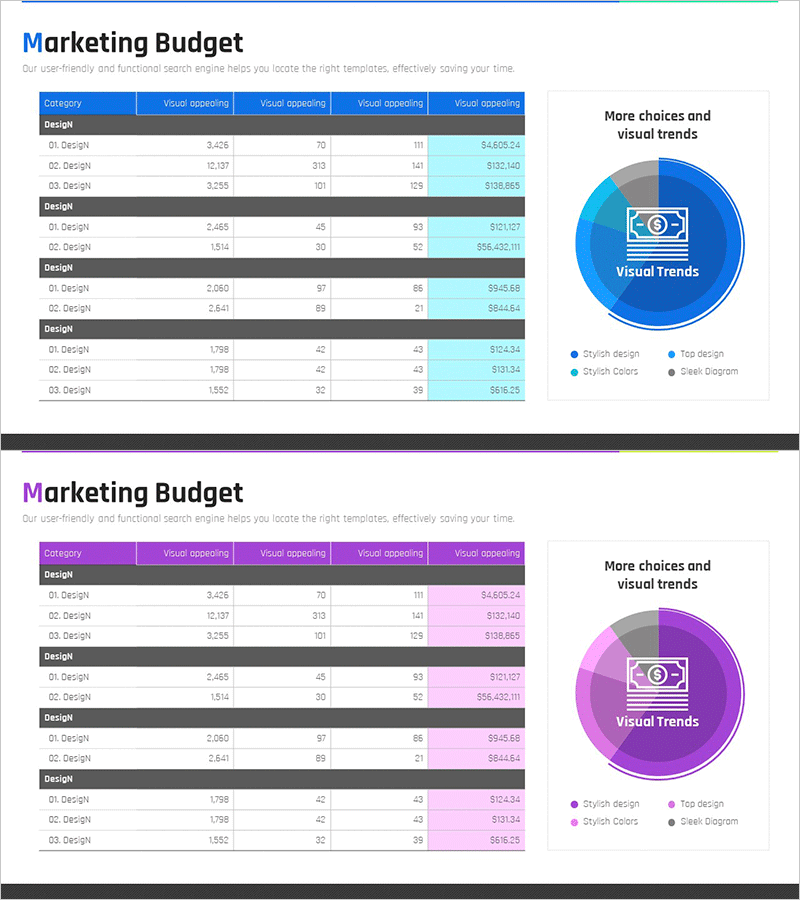
A PowerPoint slide that visualizes annual marketing budget allocation using pie charts. Available in two color versions—blue and pink—each clearly representing budget distribution by category. The two-column layout combines a data table on the left with a circular chart on the right, enabling simultaneous presentation of numerical values and proportions. Ideal for marketing department budget reports, financial performance analysis, and executive presentations. Includes 2 slides in 16:9 widescreen format.
Usage Points
-
Main Usage
Visualizes annual marketing budget distribution by category using pie charts, clearly communicating budget status to executives and stakeholders. Serves as a financial performance analysis and budget efficiency review document.
-
How to Use
Enter marketing channel or category budget amounts in the left data table, and the right pie chart automatically reflects the proportional distribution. Select either the blue or pink color version to match your company brand and presentation context.
-
Recommended For
Recommended for marketing department quarterly and annual budget reports, CFO and finance team marketing investment reviews, executive meeting materials, and investor presentation marketing cost sections.
-
Slide Structure
2-slide set. Each slide features a data table on the left displaying 4–5 budget categories with amounts and percentages, paired with a corresponding pie chart on the right. One slide in blue version and one in pink version provided.
Related Products
-

Network Development Budget and Profit and Loss Statement – Financial Planning Visualization
#Financial Plans and Performance #Diagram #Income Statement
-

Marketing Budget Allocation Table – Effective Budget Planning
#Financial Plans and Performance #Diagram #Income Statement
-

Slide Template Presenting Text and Numbers – Communication and Efficiency
#Financial Plans and Performance #Diagram #Income Statement
-

Table Chart Comparison Slide – Visualizing Financial Performance
#Financial Plans and Performance #Diagram #Income Statement
