SWOT Analysis Puzzle Diagram – Visualizing Strengths
RM0400010_15
- Last Update 02/17/2025
- File Size 0.3MB
- # of Slides 2
- File Format PPTX
- Slide Ratio 16:9
- Color
Keywords
About the Product
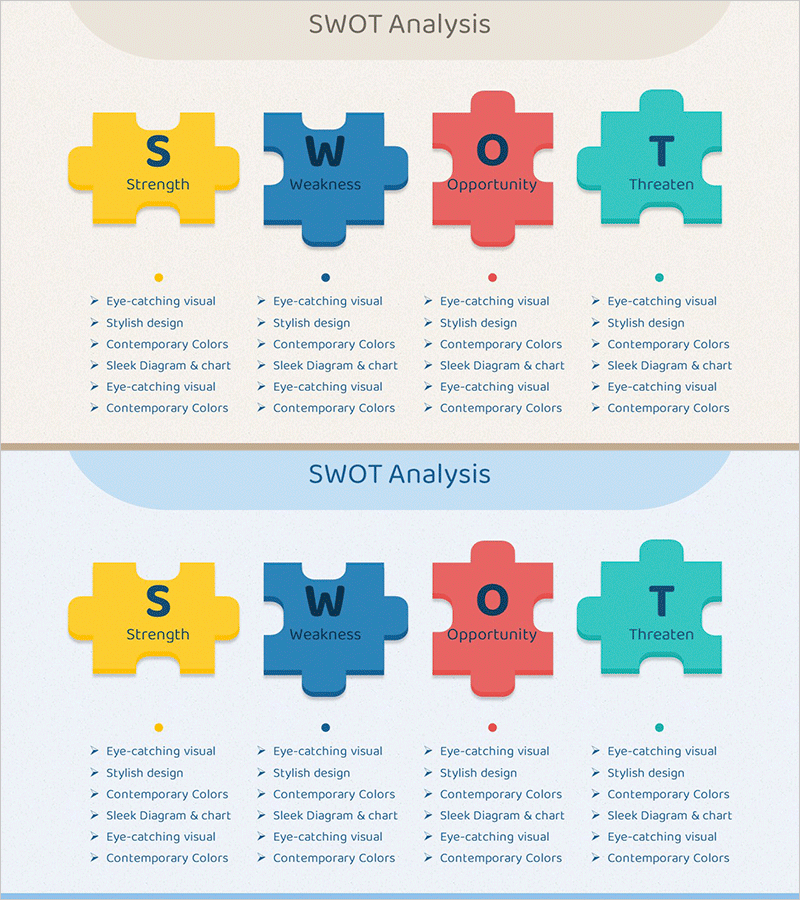
A PowerPoint slide that visualizes SWOT analysis using four puzzle pieces, each representing a distinct strategic element. Strengths appear in yellow, Weaknesses in blue, Opportunities in red, and Threats in turquoise, creating immediate visual differentiation. The 2-slide deck includes a primary layout and a detailed version, with text areas beneath each puzzle segment for listing key points. This presentation template is ready to use in executive reports, strategic planning sessions, market analysis briefings, and competitive assessments.
Usage Points
-
Main Usage
This SWOT diagram structures business analysis into four puzzle-shaped segments, enabling quick comprehension of organizational strengths, weaknesses, market opportunities, and threats. It is designed for strategic planning, market entry analysis, competitive positioning, and executive decision-making presentations where clear visual organization of complex information is essential.
-
How to Use
Enter specific content into the text areas below each puzzle piece (S, W, O, T). The color-coded segments allow audiences to instantly distinguish between the four strategic elements. Deploy this slide in board meetings, strategy workshops, investor pitches, and business planning sessions to communicate organizational positioning clearly.
-
Recommended For
Executives, strategy planners, marketing managers, business development professionals, and management consultants preparing strategic analyses, business plans, and competitive assessments. Ideal for executive summaries, board presentations, investor relations materials, and corporate strategic reviews.
-
Slide Structure
Two-slide layout featuring four color-coded puzzle pieces (yellow Strength, blue Weakness, red Opportunity, turquoise Threat) with 5-6 lines of text space beneath each segment. The second slide mirrors the first layout, allowing for extended analysis or alternative scenarios.
Related Products
-

SWOT Analysis Circular Diagram – Enhancing Market Competitiveness
#Market and Competitor Analysis #Diagram #SWOT Analysis
-

SWOT Analysis Square Diagram – Essence of Market Analysis
#Market and Competitor Analysis #Diagram #SWOT Analysis
-

SWOT Analysis Closed Square Diagram
#Market and Competitor Analysis #Diagram #SWOT Analysis
-

SWOT Analysis Closed Diagram – Market and Competitor Analysis Template
#Market and Competitor Analysis #Diagram #SWOT Analysis
