Annual Marketing Budget Plan – Budget Management and Performance Forecast
RM0400008_26
- Last Update 02/16/2025
- File Size 0.3MB
- # of Slides 2
- File Format PPTX
- Slide Ratio 16:9
- Color
Keywords
- #Content-Based Slides
- #Design-Based Slides
- #Financial Plans and Performance
- #Diagram
- #Projected Return on Investment (ROI)
- #Budget
- #Table
- #16:9
- #marketing budget PowerPoint slide
- #budget planning table slide
- #annual budget comparison PPT
- #how to create a budget table in PowerPoint
- #financial data table template
About the Product
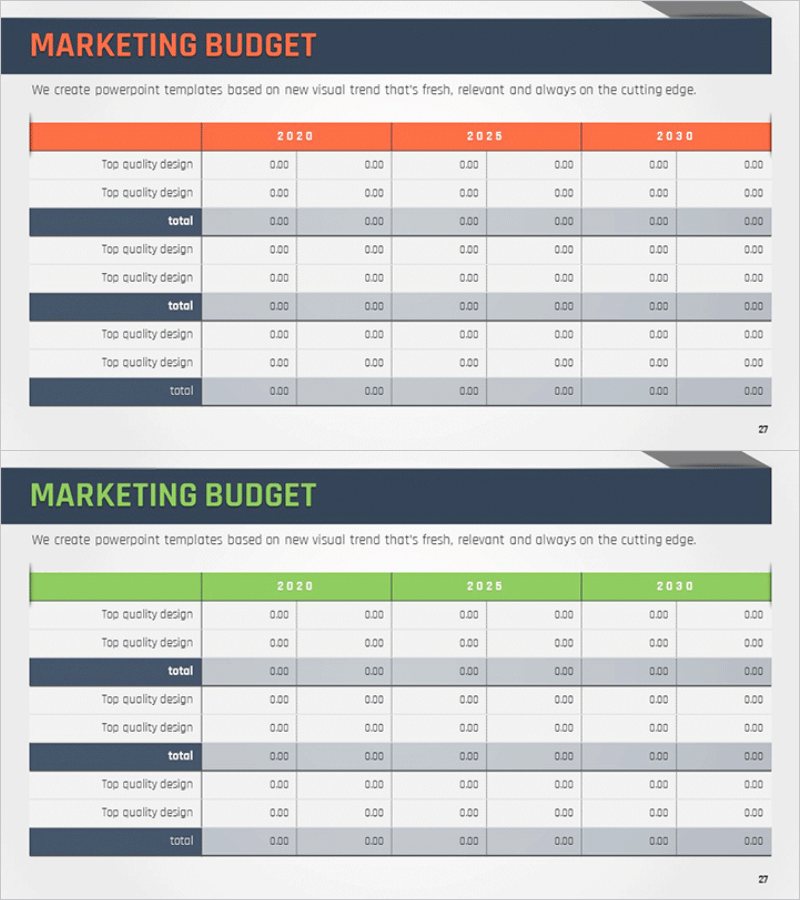
A PowerPoint slide designed for marketing budget planning and financial forecasting. This 2-slide set features orange and green header bars with dark blue row separators for clear visual hierarchy. Each slide displays a data table comparing three fiscal years (2028, 2029, 2030) across six columns, with dedicated cells for budget line items and numerical input. The layout is ideal for marketing strategy presentations, financial reports, and budget approval meetings where stakeholders need to review spending allocations and performance projections.
Usage Points
-
Main Usage
Present annual marketing budget plans and 3-year financial forecasts in a structured table format, enabling clear communication of budget allocation rationale and expected outcomes to executives and investors.
-
How to Use
Insert this slide into the financial section of marketing proposals, budget approval presentations, and quarterly performance reports. Replace category labels and numerical values with your organization's actual data for immediate use in executive meetings.
-
Recommended For
Marketing managers, finance professionals, CFOs, executives, and investors reviewing budget proposals. Particularly effective during budget reviews, performance evaluations, and strategic planning cycles where data-driven decision-making is essential.
-
Slide Structure
Two identical slides with orange or green header (title area) + three year columns (2028, 2029, 2030) + six data columns + dark blue total row. Each slide groups 2–3 budget categories with 0.00-formatted numerical cells for consistent data entry and professional appearance.
Related Products
-

Medical Business Expected Funding Requirements Table – Efficient Financial Planning
#Financial Plans and Performance #Diagram #Projected Return on Investment (ROI)
-

Environmental Pollution Infographic Table Template
#Financial Plans and Performance #Diagram #Projected Return on Investment (ROI)
-

Business Budget Summary Table – Visualizing Financial Plans and Performance
#Financial Plans and Performance #Diagram #Projected Return on Investment (ROI)
-

Startup Funding Needs Analysis Chart
#Financial Plans and Performance #Diagram #Projected Return on Investment (ROI)
