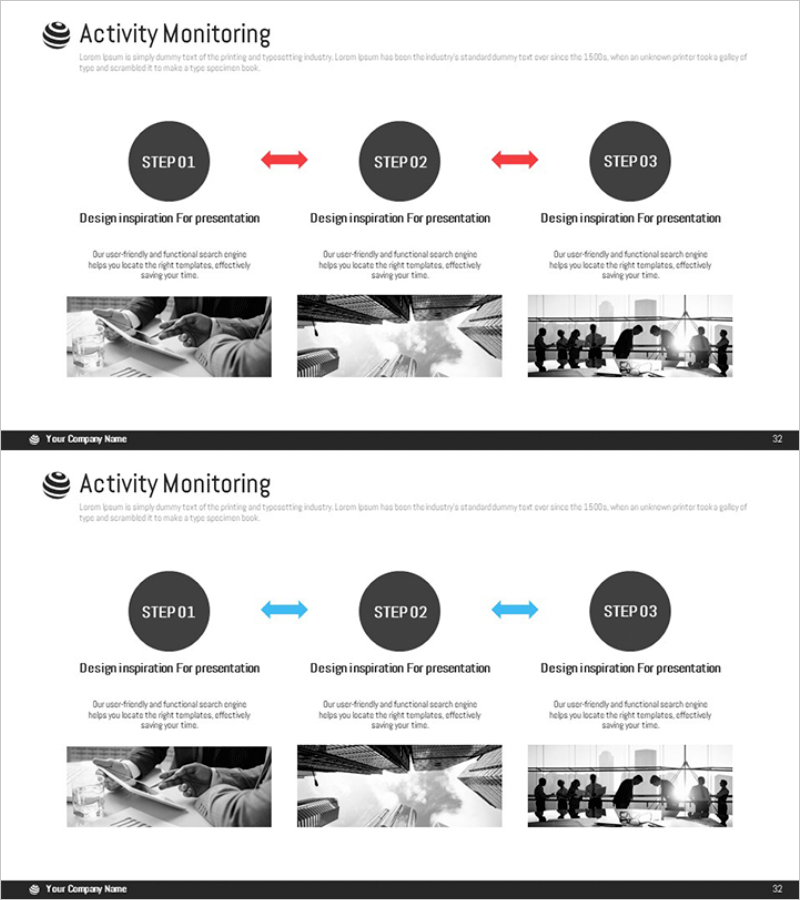
Step-by-step Program Analysis Diagram – Cluster-Focused Business Operations
RM0400006_31
- Last Update 02/16/2025
- File Size 1.2MB
- # of Slides 2
- File Format PPTX
- Slide Ratio 16:9
- Color
Keywords
- #Content-Based Slides
- #Design-Based Slides
- #Product/Service Introduction
- #Business Management
- #Operational Plan
- #Diagram
- #Program Introduction
- #Implementation Plan
- #Cluster
- #16:9
- #step-by-step analysis diagram PowerPoint
- #program analysis slide
- #3-stage cluster diagram
- #business process PPT
- #how to create process flow in PowerPoint
About the Product
A cluster-focused PowerPoint slide diagram for analyzing three-stage programs and business operations. This presentation slide visualizes design inspiration and implementation details for each stage, with red arrows emphasizing the connection between phases. The flexible layout accommodates both images and text in each section, making it ideal for strategy presentations and process flow explanations. Effectively communicates sequential workflows to audiences and supports decision-making discussions. Available in 16:9 PPTX format for immediate editing.
Usage Points
-
Main Usage
Visualizes business processes, project phases, and service development workflows across three stages. Simultaneously presents design inspiration, implementation details, and outcomes for each stage, supporting strategy discussions and improving process comprehension in executive meetings.
-
How to Use
Insert relevant titles, descriptions, and images into each stage section. Red arrows represent causality or sequential flow, making this ideal for topics with clear process progression. Customize arrow colors to match your company branding for consistent visual identity.
-
Recommended For
Recommended for strategy presentations, business planning, project management, service development explanations, and organizational operations overviews. Effective for executives, team leaders, project managers, and consultants explaining phase-by-phase progress.
-
Slide Structure
Two-slide set with identical 3-stage cluster structure: first slide features red connecting arrows, second slide features blue arrows. Each slide contains three stage sections with dedicated areas for title text, description text, and images, creating clear information hierarchy.
Related Products
-

Marketing Effectiveness Step-by-Step Analysis Diagram – Business Management and Operations Planning
#Product/Service Introduction #Business Management #Operational Plan
-

AI Service Promotion Plan Diagram
#Business Management #Operational Plan #Diagram
-

Marketing Services Areas of Activity Slide – Visualization of Action Plans
#Business Management #Operational Plan #Diagram
-

Visualizing the Collaborative Process – Cluster Slide
#Business Management #Operational Plan #Diagram
