Company Positioning Analysis Table – Visualizing Marketing Strategy
RM0400005_9
- Last Update 02/15/2025
- File Size 4MB
- # of Slides 2
- File Format PPTX
- Slide Ratio 16:9
- Color
Keywords
About the Product
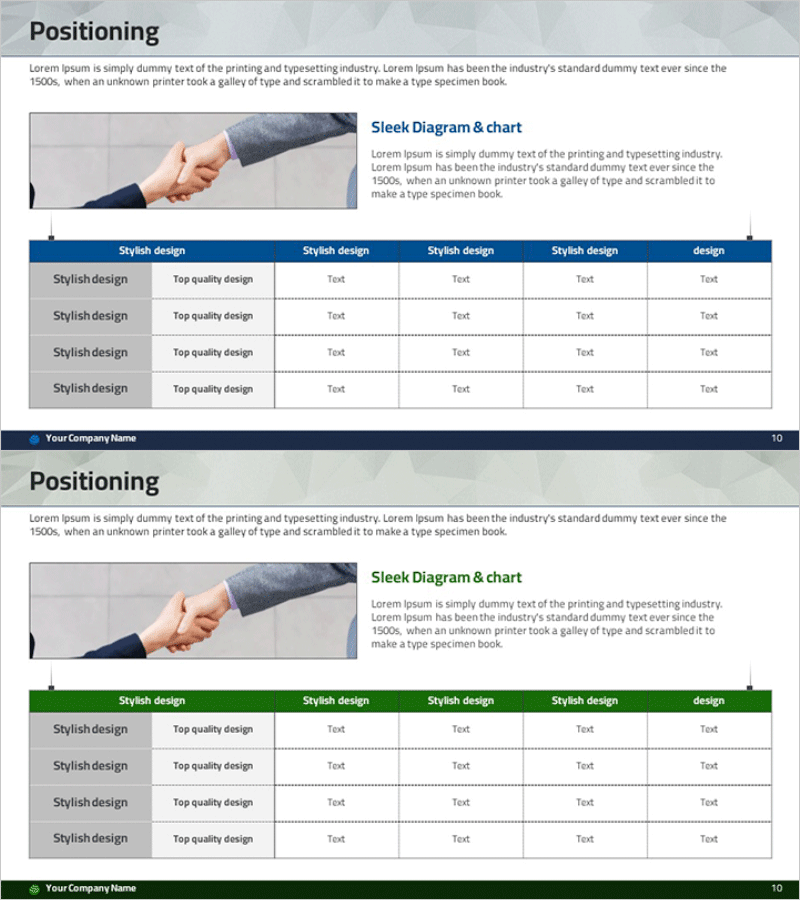
A PowerPoint slide designed for visualizing company positioning analysis during marketing strategy development. Features a balanced layout with a two-color header (navy blue and green) table format, combining a left-side image area with right-side text description space. The 4-row by 6-column data table enables clear comparison of your company's strengths and differentiation against competitors. Ideal for immediate use in presentations, planning documents, and strategic reports. Supplied in 16:9 widescreen format with 2 slides to accommodate various positioning scenarios.
Usage Points
-
Main Usage
Used during marketing strategy development to compare your company's market positioning against competitors. The combined image and text layout intuitively conveys positioning concepts, while the table format systematically organizes various positioning elements such as price point, quality, features, and brand image.
-
How to Use
Insert product photos or competitor images in the left image area, and explain positioning concepts in the right 'Sleek Diagram & Chart' section. Enter comparison items (price range, target audience, key features, differentiation factors) in the bottom table for at-a-glance comparison. Use both slides to represent current positioning and target positioning separately.
-
Recommended For
Marketing managers, strategy planning teams, and new business development teams use this when presenting positioning strategy to executives, investors, and partners. Suitable for marketing plans, business proposals, strategic reports, and product launch presentations where clear communication of competitive advantage is essential.
-
Slide Structure
Each slide consists of a title section (Positioning), left image area (approximately 40%), right text description area (approximately 30%), and bottom 4-row by 6-column data table (approximately 30%). Headers are differentiated by navy blue or green to clearly represent two positioning scenarios, with editable text fields in each cell.
Related Products
-

Business Market Positioning Analysis – The Core of Marketing Strategy
#Marketing Plan and Strategy #Diagram #Graph
-

Distribution Analysis Positioning Map – Visualizing Marketing Strategy
#Marketing Plan and Strategy #Diagram #Other
-

Positioning Analysis Chart - Visualization for Marketing Strategies
#Marketing Plan and Strategy #Diagram #Positioning
-

Point Distribution Positioning Map – Visualization of Marketing Strategy
#Marketing Plan and Strategy #Diagram #Graph
