Distribution Analysis Positioning Map – Visualizing Marketing Strategy
RM0400001_9
- Last Update 02/14/2025
- File Size 0.5MB
- # of Slides 2
- File Format PPTX
- Slide Ratio 16:9
- Color
Keywords
About the Product
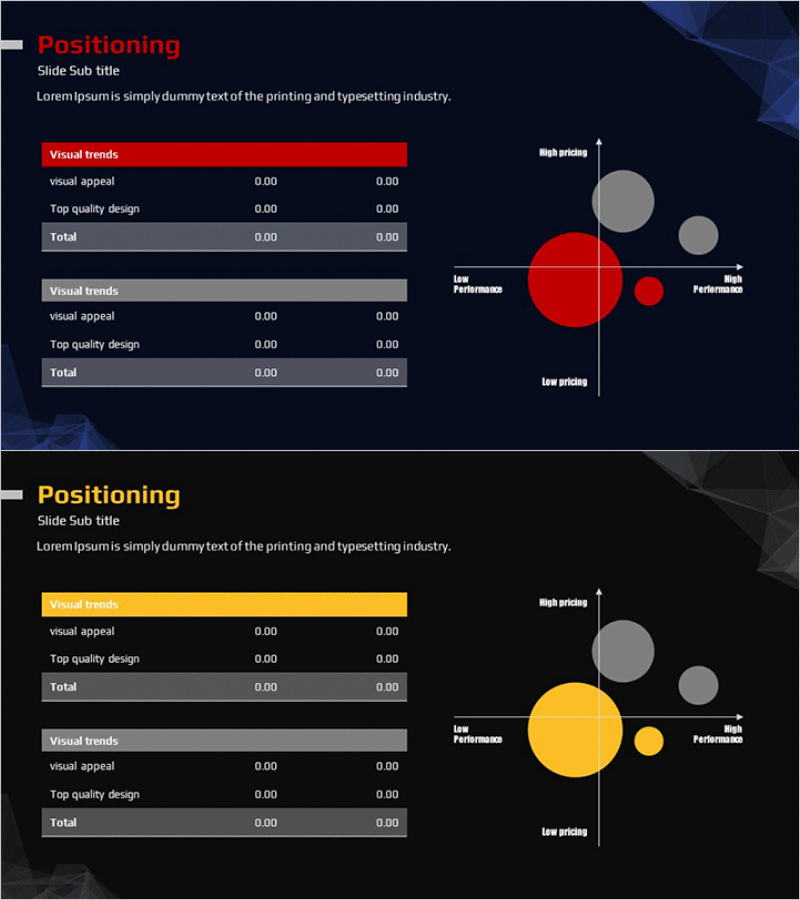
A 2-slide PowerPoint presentation template for visualizing competitive positioning in marketing strategy development. Featuring a dark background with red and yellow accent colors, this bubble chart format displays product and service market positions across two axes: price range (low to high) and performance (low to high). The left side includes a visual trends analysis table with numerical data, while the right side presents the corresponding bubble chart. Ideal for competitive analysis sections in business proposals, strategy reports, and marketing presentations. All colors, data values, and bubble sizes are fully editable to match your specific market analysis.
Usage Points
-
Main Usage
Visualize competitive positioning and your company's market position using a 2-axis framework (price and performance) to support marketing strategy decisions. Bubble size can represent market share, enabling multi-layered competitive analysis and strategic positioning insights.
-
How to Use
Insert this slide into business plans, marketing strategy documents, or competitive analysis reports. Replace the left-side data table with actual competitor information and adjust bubble positions, sizes, and colors on the right chart to highlight your company's positioning. Ideal for executive presentations and investor pitch decks explaining market opportunities.
-
Recommended For
Marketing managers, strategy planners, business development teams, and investment pitch presenters benefit from this template when communicating competitive landscape analysis. Perfect for product repositioning reviews, market entry strategy discussions, and competitive benchmarking presentations.
-
Slide Structure
Two-slide layout with each slide divided into left data table (3 rows × 2 columns: visual appeal, top quality design, and total metrics) and right bubble chart (X-axis: low to high price, Y-axis: low to high performance). Three to five competitor positions are represented using red, yellow, and gray bubbles with clearly labeled axes and legend.
Related Products
-

Business Market Positioning Analysis – The Core of Marketing Strategy
#Marketing Plan and Strategy #Diagram #Graph
-

Point Distribution Positioning Map – Visualization of Marketing Strategy
#Marketing Plan and Strategy #Diagram #Graph
-

Clothing Market Positioning Map – Strategic Analysis
#Market and Competitor Analysis #Marketing Plan and Strategy #Diagram
-

Positioning Point Area Graph – Strategy for Market Analysis
#Market and Competitor Analysis #Marketing Plan and Strategy #Diagram
