Field-by-field Development Status Analysis Diagram – Insightful Visual Overview
RM0400005_8
- Last Update 02/15/2025
- File Size 3MB
- # of Slides 2
- File Format PPTX
- Slide Ratio 16:9
- Color
Keywords
- #Content-Based Slides
- #Design-Based Slides
- #Product/Service Introduction
- #Marketing Plan and Strategy
- #Diagram
- #Development Status
- #Target Setting
- #Cluster
- #Closed Cluster Diagram
- #16:9
- #closed-form diagram PowerPoint
- #4-item circular diagram slide
- #development status analysis presentation
- #business diagram template
- #how to create analysis diagram in PowerPoint
About the Product
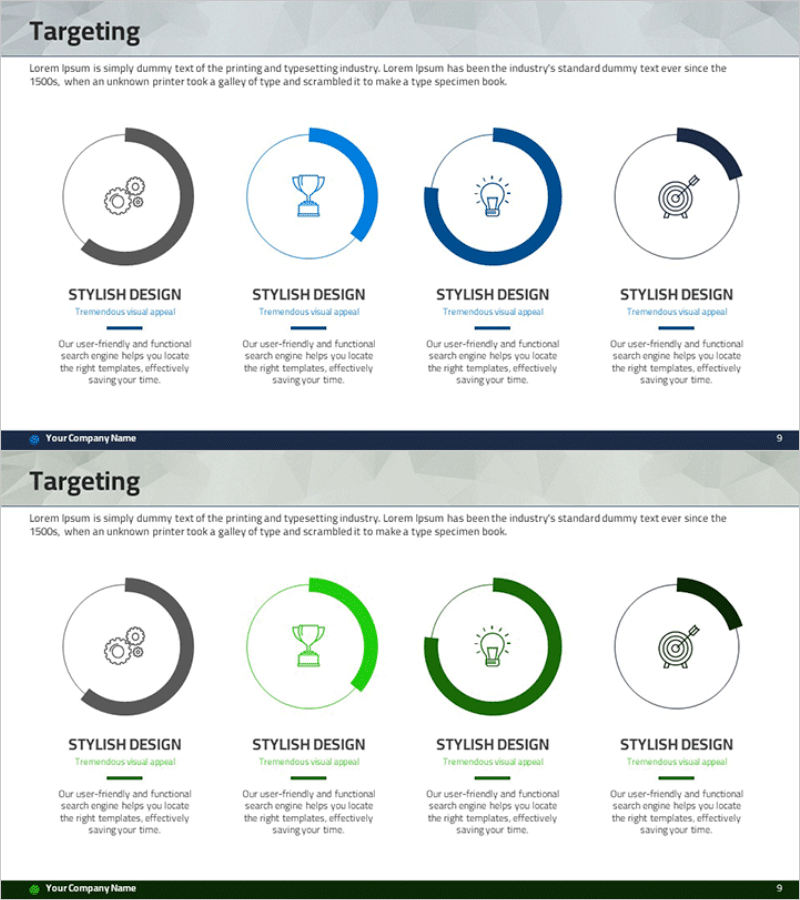
A closed-form diagram PowerPoint slide featuring four circular nodes with independent icons and text areas arranged in a center-focused structure. The design uses a professional color palette of dark gray, light blue, dark blue, and black tones to emphasize credibility and clarity. This slide template is ideal for business presentations including development status reports, marketing plans, and product introductions. The 16:9 widescreen format contains 2 slides that can be immediately customized to match your presentation needs by editing each node's content and colors.
Usage Points
-
Main Usage
Express four independent items in a center-focused structure to simultaneously compare and analyze status, progress, and performance across different fields. Effectively visualize multi-layered data such as development stage completion rates, marketing channel performance, and product feature maturity in an intuitive format.
-
How to Use
Replace each circular node's icon and text with your own data and insert into your presentation slides. This template works best in the status analysis section of company reports, product introduction presentations, and marketing strategy proposals. Customize colors to match your brand identity and corporate guidelines.
-
Recommended For
Suitable for business reports, product development status presentations, marketing strategy meetings, investor pitch decks, and organizational performance evaluation presentations. Ideal for planning teams, marketing departments, development teams, and executive-level audiences who need to communicate complex information clearly.
-
Slide Structure
Consists of 2 slides, each featuring 4 circular nodes arranged in a closed-form diagram layout. The first slide uses dark gray, light blue, dark blue, and black tones; the second provides a green-toned color variation. Each node contains an icon area, title field, and descriptive text section for flexible content customization.
Related Products
-

Diagram Explaining Brain Structure with Galaxy Theme
#Product/Service Introduction #Diagram #Development Status
-

Graph of Car Type Analysis by Year – Market Insights
#Product/Service Introduction #Market and Competitor Analysis #Diagram
-

Review and Flag Illustration – Business Vision and Marketing Strategy
#Business Vision and Strategy #Marketing Plan and Strategy #Diagram
-

Comparative Analysis Graph of Work Progress Status – Visual Data Insights
#Product/Service Introduction #Business Introduction #Diagram
