Customer Segmentation Analysis Diagram – In-Depth Customer Insights
RM0400005_11
- Last Update 02/15/2025
- File Size 3MB
- # of Slides 2
- File Format PPTX
- Slide Ratio 16:9
- Color
Keywords
- #Content-Based Slides
- #Design-Based Slides
- #Company Introduction
- #Market and Competitor Analysis
- #Diagram
- #Business Areas
- #Customer Analysis
- #Spread
- #Centralized Diagram
- #16:9
- #customer segmentation diagram PowerPoint
- #radial diagram template
- #customer analysis slide
- #how to create customer segmentation in PowerPoint
- #customer insights presentation template
About the Product
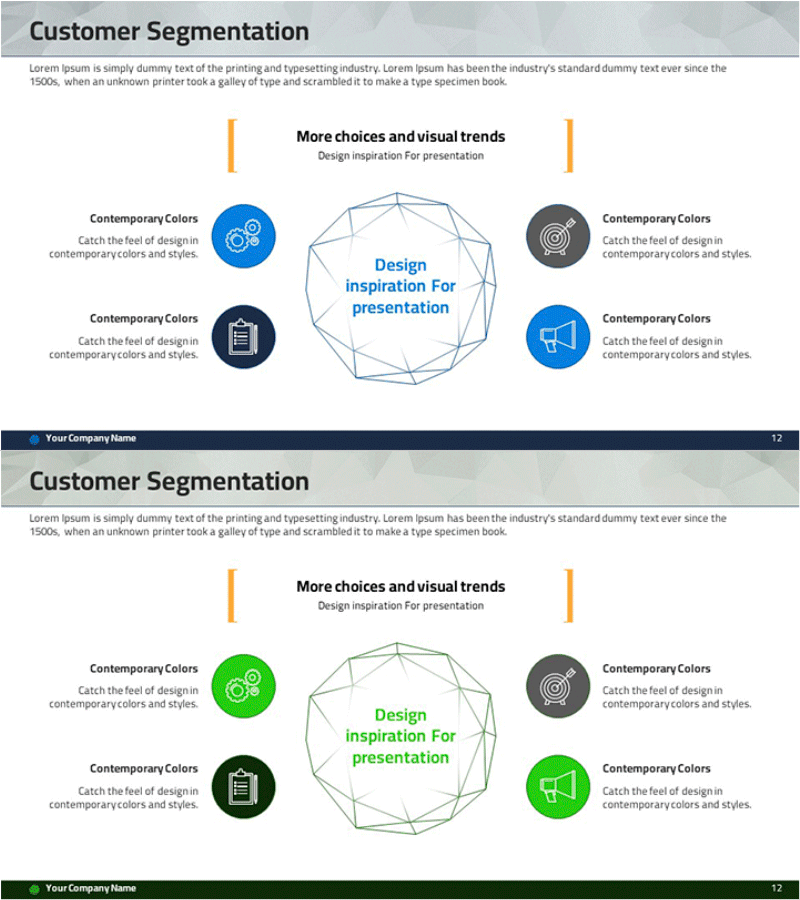
A radial customer segmentation analysis diagram PowerPoint slide featuring a central hub with four customer segments radiating outward. Each segment is represented by a circular icon in blue and gray tones, with orange vertical accent lines creating visual symmetry on both sides. The 2-slide deck includes two color variations: blue and green themes, allowing you to match your brand guidelines. Delivered in 16:9 widescreen PPTX format for immediate editing and integration into your business presentations.
Usage Points
-
Main Usage
Visually communicate customer segmentation analysis results and illustrate the relationships between different customer groups. The radial layout with a central focal point makes it ideal for presenting customer insights, marketing strategies, and business analysis findings to stakeholders.
-
How to Use
Enter your analysis topic in the central hexagon shape. Add segment names, characteristics, size, or behavioral patterns in the text boxes adjacent to each of the four circular icons. Replace icons with images that represent your customer types, and adjust colors to match your corporate branding.
-
Recommended For
Marketing managers, business analysts, product managers, and sales leaders presenting customer analysis findings to executives and teams. Particularly effective for customer-based strategy development, targeted marketing planning, and customer experience improvement discussions.
-
Slide Structure
Two-slide set with identical radial diagram layouts in different color schemes: blue-gray theme and green-gray theme. Each slide features a central hexagon, four circular icons (gear, clipboard, megaphone, target), two orange vertical accent lines, and designated text input areas for segment information.
Related Products
-

Sleep Effect Diagram – Centralized Data Visualization
#Company Introduction #Market and Competitor Analysis #Diagram
-

Business Area PC Mockup Diagram – Optimized for Market Analysis
#Company Introduction #Market and Competitor Analysis #Diagram
-

Financial Services Solutions Diagram – Highlighting Business Core and Values
#Company Introduction #Business Introduction #Diagram
-

Science Business Area Diffusion Diagram – Connecting the Future of Business
#Company Introduction #Business Introduction #Diagram
