Marketing Schedule Planning Planner – Effective Business Strategy Implementation
RM0400004_29
- Last Update 02/15/2025
- File Size 2MB
- # of Slides 2
- File Format PPTX
- Slide Ratio 16:9
- Color
Keywords
About the Product
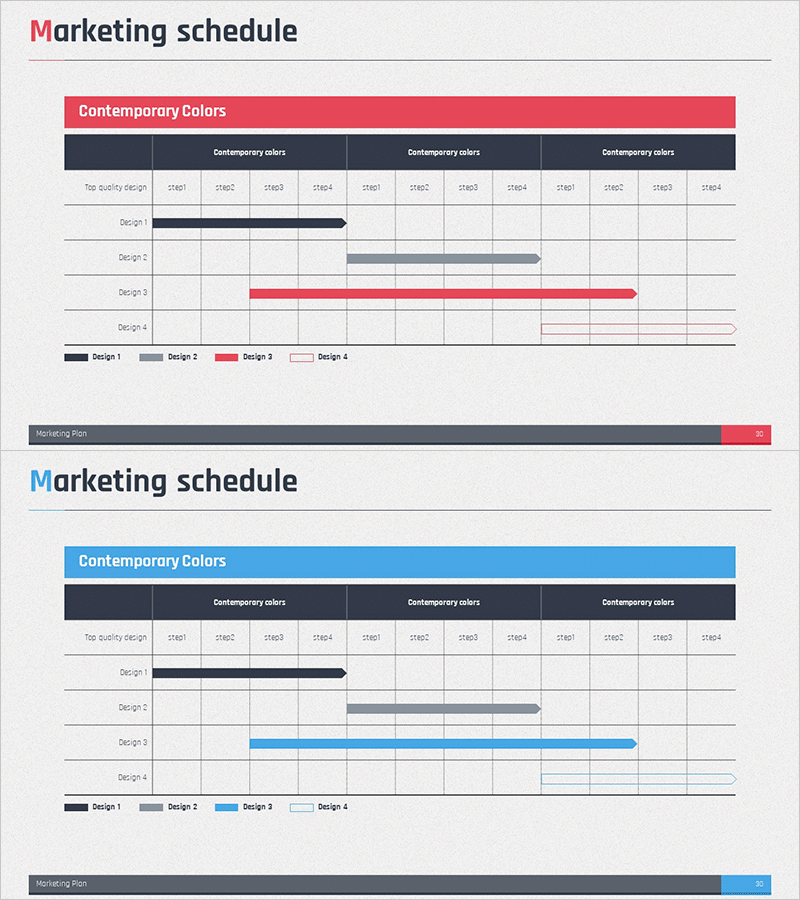
A professional Gantt chart-style PowerPoint slide for visualizing marketing project timelines and execution schedules. Features four design variations with color-coded bars (navy, gray, red, and outlined styles) representing different project phases. The red header bar and dark gray column structure create clear information hierarchy, enabling stakeholders to understand project progress at a glance. Ideal for marketing campaign planning, product launch schedules, and business strategy presentations. Includes 12 time period columns and 4 phase rows for comprehensive project tracking and timeline communication.
Usage Points
-
Main Usage
Visualize and communicate marketing campaign timelines, product launch schedules, and business project phases to stakeholders. The Gantt chart format clearly displays start dates, end dates, and duration for each project phase, making it ideal for project status updates, investor presentations, and strategic planning meetings.
-
How to Use
Enter project names, phase names, and timeframes in the designated text areas. Select from four color design options based on your presentation theme. Insert into marketing strategy presentations, business plan reports, or investor pitch decks in the execution plan or timeline section to clearly communicate project schedules and responsibilities.
-
Recommended For
Marketing managers, project managers, business planning teams, and executives preparing status reports. Particularly useful for communicating campaign schedules, new product launch timelines, and organizational project milestones to internal and external audiences.
-
Slide Structure
Two-slide set with red header and blue header versions. Each slide contains a title area, central Gantt chart table (4 phase rows × 12 time period columns), and legend showing four color-coded design options. Total of 16 editable text fields: 4 phase names and 12 time period labels for flexible project customization.
Related Products
-

Business Problem Resolution Plan Schedule – Strategic Approach
#Business Strategy #Operational Plan #Diagram
-

Calendar Illustration Table – Visualizing Business Strategy
#Business Strategy #Business Management #Diagram
-

Business Idea Service Roadmap – Business Strategy
#Business Strategy #Operational Plan #Diagram
-

Schedule Checklist for Business Strategy – Efficient Management
#Business Strategy #Operational Plan #Diagram
