Consumer Segmentation Analysis Silhouette Diagram - Visual Insight
RM0400003_11
- Last Update 02/14/2025
- File Size 3.6MB
- # of Slides 2
- File Format PPTX
- Slide Ratio 16:9
- Color
Keywords
- #Content-Based Slides
- #Design-Based Slides
- #Market and Competitor Analysis
- #Financial Plans and Performance
- #Diagram
- #Other
- #Customer Analysis
- #Balance Sheet
- #Cluster
- #Chain Diagram
- #Silhouette
- #16:9
- #customer segmentation silhouette PowerPoint
- #segmentation diagram slide template
- #consumer analysis presentation
- #customer profiling PPT
- #market segmentation slide design
About the Product
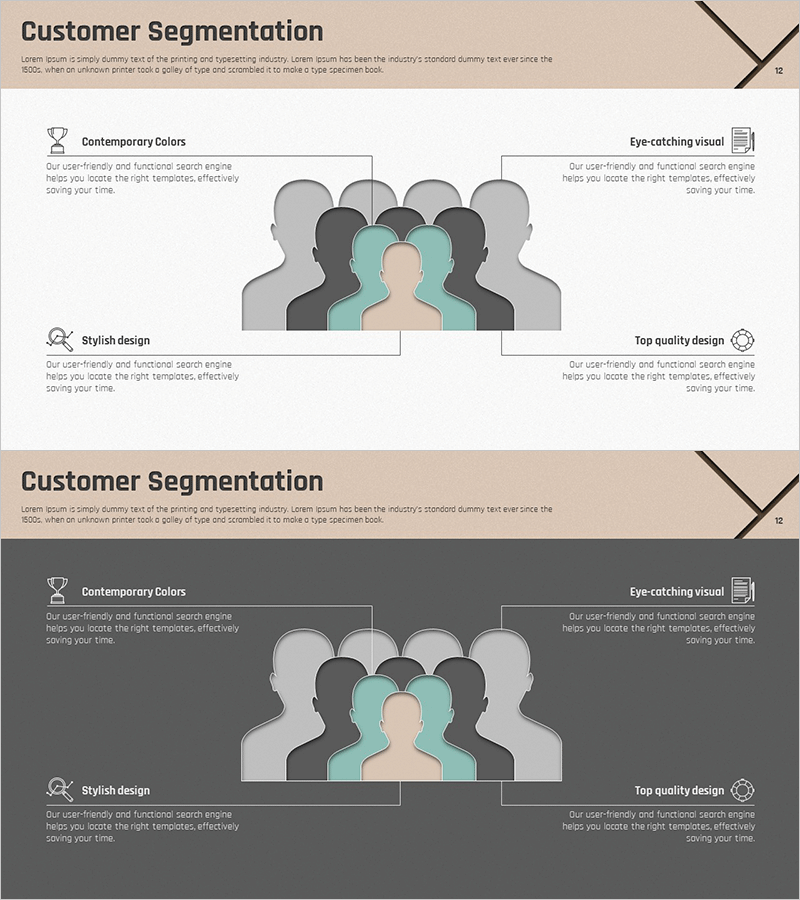
A silhouette-based diagram PowerPoint slide designed for consumer segmentation analysis. Features five silhouettes arranged in a center-focused structure against a light beige background, with dark tones and light blue accent color highlighting the primary target customer segment. The two-slide deck includes both light and dark background versions for flexible presentation contexts. Left and right text areas allow detailed description of each segment's characteristics. Fully editable PPTX format supports immediate customization for market analysis, customer profiling, and marketing strategy development.
Usage Points
-
Main Usage
Visually communicate consumer segmentation analysis results and enable side-by-side comparison of customer group characteristics and scale. Silhouette shapes maintain anonymity while emphasizing customer diversity, with center-focused design highlighting the primary target segment.
-
How to Use
Add segment names (e.g., price-sensitive, premium, new customers) and characteristics next to each silhouette. Insert segment-specific icons in the left information area and behavioral traits or statistics in the right section. Use color emphasis to visually differentiate key segments and draw audience attention.
-
Recommended For
Ideal for marketing managers, strategy planning teams, sales leaders, and executive presentations. Effective in new product launch strategies, marketing campaign planning, customer relationship management (CRM) strategy development, market analysis reports, and investor pitch decks explaining customer-based analysis.
-
Slide Structure
Two-slide set: Slide 1 features light beige background with five silhouettes in gray, dark, and light blue tones; Slide 2 uses dark gray background with identical structure. Both slides include title area at top, centered five-person silhouette group, and left-right text and icon input areas for customization.
Related Products
-

Office Worker Briefcase Silhouette Diagram – Intuitive Customer Analysis
#Product/Service Introduction #Market and Competitor Analysis #Diagram
-

Bike and Racer Diagram – Visualization for Customer Analysis
#Product/Service Introduction #Market and Competitor Analysis #Diagram
-

Human Details Infographic Chart – Customer Analysis and Market Overview
#Market and Competitor Analysis #Graph #Other
-

Running Silhouettes and Analytical Text – Dynamic Market Analysis
#Product/Service Introduction #Market and Competitor Analysis #Diagram
