User Analysis Silhouette – Visualizing Customer Insights
RJ0400011_13
- Last Update 05/19/2025
- File Size 0.4MB
- # of Slides 2
- File Format PPTX
- Slide Ratio 16:9
- Color
Keywords
About the Product
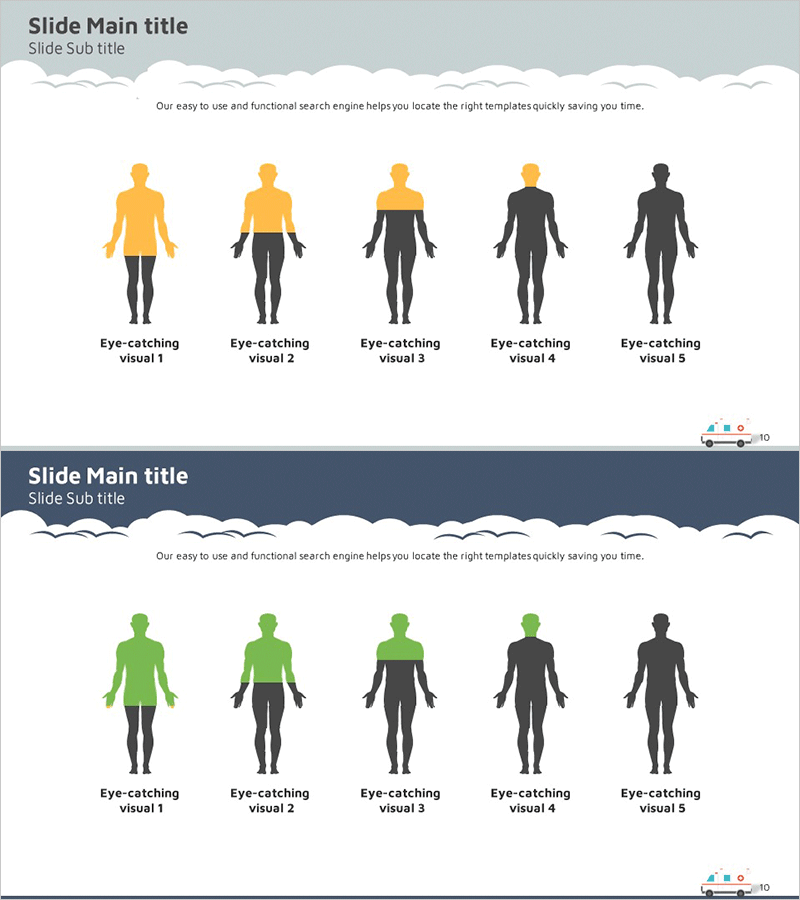
A 2-slide PowerPoint presentation that visualizes customer insights through silhouette figures. Five silhouettes transition from orange to black in a gradient effect, making it ideal for customer segmentation, user analysis, and competitive market analysis. Each silhouette includes a label area below for entering customer personas, target groups, or user characteristics. This slide deck is optimized for presentations, marketing plans, and proposals where customer analysis sections need visual impact.
Usage Points
-
Main Usage
This slide visually represents customer segmentation, user analysis, and target market definition. Five silhouettes depict customer personas, user groups, or market segments, while the gradient color transition effectively conveys priority levels or characteristic differences.
-
How to Use
Use in the target customer section of marketing plans, customer analysis pages in proposals, or market analysis portions of business plans. Enter customer characteristics, age groups, professions, or purchase patterns in the text areas below each silhouette to enhance audience understanding.
-
Recommended For
Marketing managers, sales planning teams, strategy consultants, and product managers presenting customer analysis findings. Particularly effective for B2B proposals, investor pitch decks, and market entry strategy presentations where customer insights need emphasis.
-
Slide Structure
Two-slide layout: first slide features gray background with orange-to-black gradient silhouettes; second slide has dark blue background with green-to-black gradient silhouettes. Each slide contains five independent text input areas for clearly distinguishing information across customer groups.
Related Products
-

Infographic in a Woman's Head – Data Analytics and Customer Insight
#Product/Service Introduction #Market and Competitor Analysis #Diagram
-

Silhouette Graph & Overlay Diagram – Market Analysis and Customer Insights
#Market and Competitor Analysis #Diagram #Other
-

Silhouette Step Diagram – Effective Tool for Market Analysis
#Market and Competitor Analysis #Graph #Other
-

Body Fat Type Analysis Slide – Cluster Diagram
#Product/Service Introduction #Market and Competitor Analysis #Diagram
