Bike and Racer Diagram – Visualization for Customer Analysis
RJ0600058_13
- Last Update 07/06/2025
- File Size 1.7MB
- # of Slides 2
- File Format PPTX
- Slide Ratio 16:9
- Color
Keywords
- #Content-Based Slides
- #Design-Based Slides
- #Product/Service Introduction
- #Market and Competitor Analysis
- #Diagram
- #Other
- #Features
- #Customer Analysis
- #Cluster
- #Chain Diagram
- #Silhouette
- #16:9
- #silhouette diagram PowerPoint
- #customer analysis presentation slide
- #3-step process diagram
- #bike racer visualization
- #market analysis PPT template
About the Product
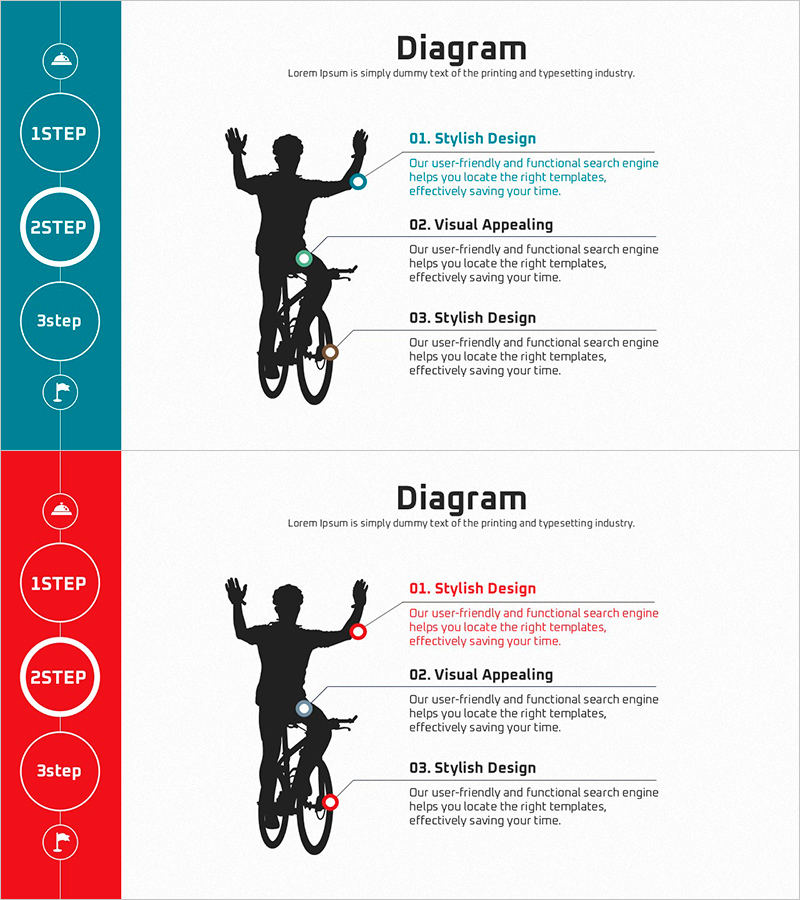
A silhouette-based diagram PowerPoint slide designed for customer analysis and market segmentation. The design features a bike racer silhouette as the central visual element, connected to three key points through a vertical timeline structure on the left side, with text areas on the right for detailed information. Available in two color versions—teal and red—with circular nodes and connecting lines that visualize process flow at each stage. The 2-slide set is formatted in 16:9 widescreen ratio, optimized for modern presentation environments, and fully editable in PPTX format.
Usage Points
-
Main Usage
Ideal for visualizing multi-stage processes such as customer segmentation, market analysis, and competitive analysis. The combination of silhouette imagery and circular nodes transforms abstract concepts into concrete visual narratives, while the left-side timeline structure clearly demonstrates step-by-step progression.
-
How to Use
Enter stage names in each circular node on the left vertical timeline, then add descriptions and key content in the right text areas. The silhouette image remains fixed while text and background colors can be customized to match your organization's brand palette. Suitable for presentation decks, strategy reports, and marketing planning documents.
-
Recommended For
Marketing professionals, strategy planners, sales analysts, consultants, and business development managers explaining customer journeys, market entry strategies, and competitive positioning. Perfect for startup pitches, corporate strategy meetings, and customer segmentation analysis presentations.
-
Slide Structure
2-slide set with each slide featuring a left-side colored panel (teal or red) containing 3 circular nodes (1STEP, 2STEP, 3STEP) arranged vertically with an icon at the bottom, and a right-side white area with the bike racer silhouette and 3 text blocks. 16:9 widescreen format, fully editable PPTX.
Related Products
-

Office Worker Briefcase Silhouette Diagram – Intuitive Customer Analysis
#Product/Service Introduction #Market and Competitor Analysis #Diagram
-

Body Fat Type Analysis Slide – Cluster Diagram
#Product/Service Introduction #Market and Competitor Analysis #Diagram
-

Body Structure Description Diagram - Infographic Design
#Product/Service Introduction #Diagram #Other
-

Bear Silhouette Diagram – Customer Analysis and Characteristics
#Product/Service Introduction #Market and Competitor Analysis #Diagram
