Customer Segmentation Analysis Table Chart – Essential for Market Understanding
RM0400002_11
- Last Update 02/14/2025
- File Size 1MB
- # of Slides 2
- File Format PPTX
- Slide Ratio 16:9
- Color
Keywords
- #Content-Based Slides
- #Design-Based Slides
- #Market and Competitor Analysis
- #Financial Plans and Performance
- #Diagram
- #Customer Analysis
- #Balance Sheet
- #Table
- #16:9
- #customer segmentation table PowerPoint
- #customer analysis presentation slide
- #5-row comparison table slide
- #market segmentation PPT
- #how to create customer segmentation chart in PowerPoint
About the Product
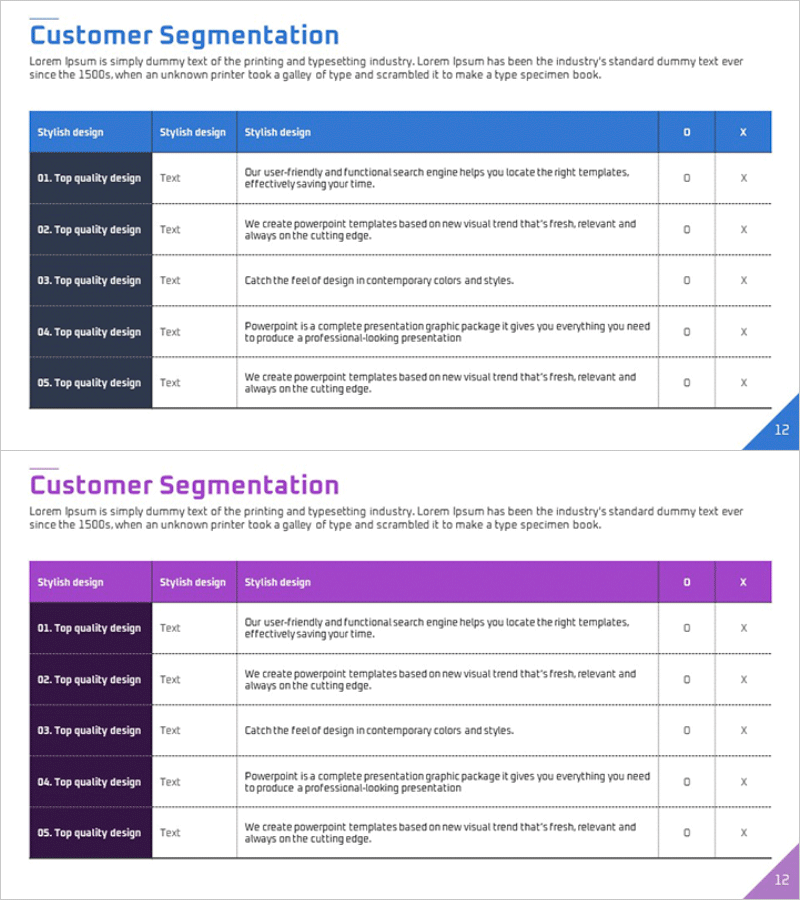
A 2-slide PowerPoint set designed for customer segmentation analysis. The first slide features a blue header with dark navy left-side labels and a 5-row comparison table that clearly distinguishes each customer segment. The second slide uses a purple header with black left-side labels in the same table structure, allowing flexible application across different document sections through color variation. Each row contains 3 text input areas per segment, enabling simultaneous expression of customer descriptions, characteristics, and strategies. Interactive O and X icons in the upper right corner indicate selection status. This slide set is highly effective for market analysis, marketing strategy development, and investor presentations to enhance understanding of target customer segments.
Usage Points
-
Main Usage
Systematically organize target segment characteristics, needs, and purchasing behaviors during market analysis and customer understanding phases. Serves as a core slide in customer analysis sections for marketing strategy development, business plans, and investor presentations.
-
How to Use
Enter customer segment names (e.g., Enterprise, SMB, Startup) in the left-side labels of each row. Fill the 3 text areas with segment characteristics, purchasing power, and preferences. Use the O and X icons on the right to mark target segments and visualize strategic priorities.
-
Recommended For
Ideal for presentations to marketing managers, business planners, and executives. Particularly essential for new business planning, marketing strategy development, investment pitch decks, and market analysis reports in the customer segmentation section.
-
Slide Structure
2-slide composition. Each slide contains 1 title area, a 5-row × 3-column table (15 total text input areas), and 2 O/X icons in the upper right corner. Two color variations (blue and purple) allow flexible application across different document sections.
Related Products
-

Balance Sheet Analysis Table – Visualize Financial Performance
#Financial Plans and Performance #Diagram #Balance Sheet
-

Financial Status Analysis by Year – Visualization of Financial Planning
#Financial Plans and Performance #Diagram #Balance Sheet
-

Balance Sheet Chart by Year – Financial Performance Analysis
#Financial Plans and Performance #Diagram #Balance Sheet
-

Balance Sheet Analysis Chart – Visualizing Financial Performance
#Financial Plans and Performance #Diagram #Balance Sheet
