Customer Segmentation Analysis Table Slide
RM0400001_11
- Last Update 02/14/2025
- File Size 0.4MB
- # of Slides 2
- File Format PPTX
- Slide Ratio 16:9
- Color
Keywords
About the Product
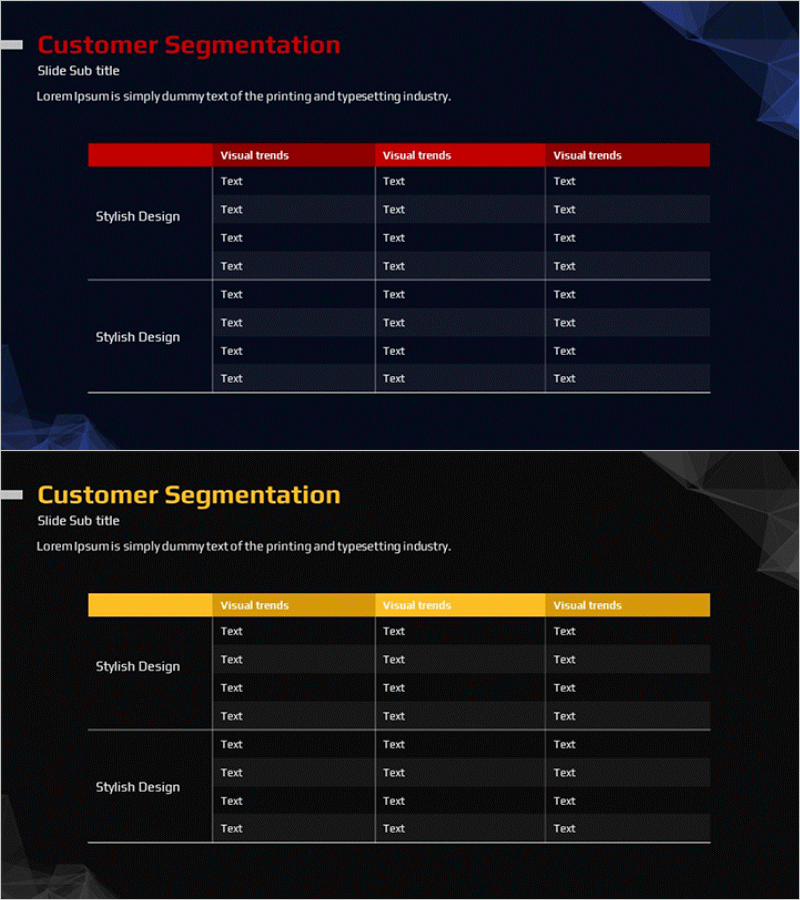
A 3-column comparison table PowerPoint slide designed for customer segmentation analysis. Featuring a dark navy background with red or gold header bars in two color versions, each column contains visual trends and four text input areas. Left-side row labels distinguish 'Stylish Design' categories, with horizontal lines clearly separating sections. Ideal for comparing customer characteristics, market trends, and competitive positioning data in an intuitive visual format. Perfect for marketing plans, market analysis reports, and investor presentations. Provided in editable 16:9 widescreen PPTX format.
Usage Points
-
Main Usage
This analysis slide enables parallel comparison of three customer dimensions—segment characteristics, market trends, and competitive positioning. With four text input areas per column, it accommodates both qualitative insights and quantitative metrics, making it highly effective for presenting data-driven decision support.
-
How to Use
Deploy in marketing plans' target customer analysis section, market analysis reports' competitive comparison pages, or investor presentations' customer positioning slides. Simply populate the header text and cell input areas with actual data for immediate presentation use.
-
Recommended For
Ideal for marketing managers, planning teams, executives, and investor audiences. Particularly recommended when explaining new business strategies, market entry plans, or customer segmentation approaches that require data-backed decision-making support.
-
Slide Structure
Two-slide set, each featuring a title area plus 3-column table structure. Tables include header row (three column titles) and two data rows (left-side row labels plus three column data cells), providing 12 total text input areas. Color versions (red/gold) create different visual emphasis effects for presentation impact.
Related Products
-

Customer Segmentation Analysis Table Chart – Essential for Market Understanding
#Market and Competitor Analysis #Financial Plans and Performance #Diagram
-

Calorie-Burning Table – Market and Customer Analysis
#Market and Competitor Analysis #Diagram #Customer Analysis
-

Flower Wedding Party Customer Assessment – Voice of the Customer
#Market and Competitor Analysis #Customer Success Stories #Diagram
-

Table Chart on Competition and Communication - Market and Customer Analysis
#Market and Competitor Analysis #Diagram #Customer Analysis
