Gradient History Diagram – Visually Representing Company Milestones
RM0300020_5
- Last Update 02/12/2025
- File Size 0.3MB
- # of Slides 2
- File Format PPTX
- Slide Ratio 16:9
- Color
Keywords
About the Product
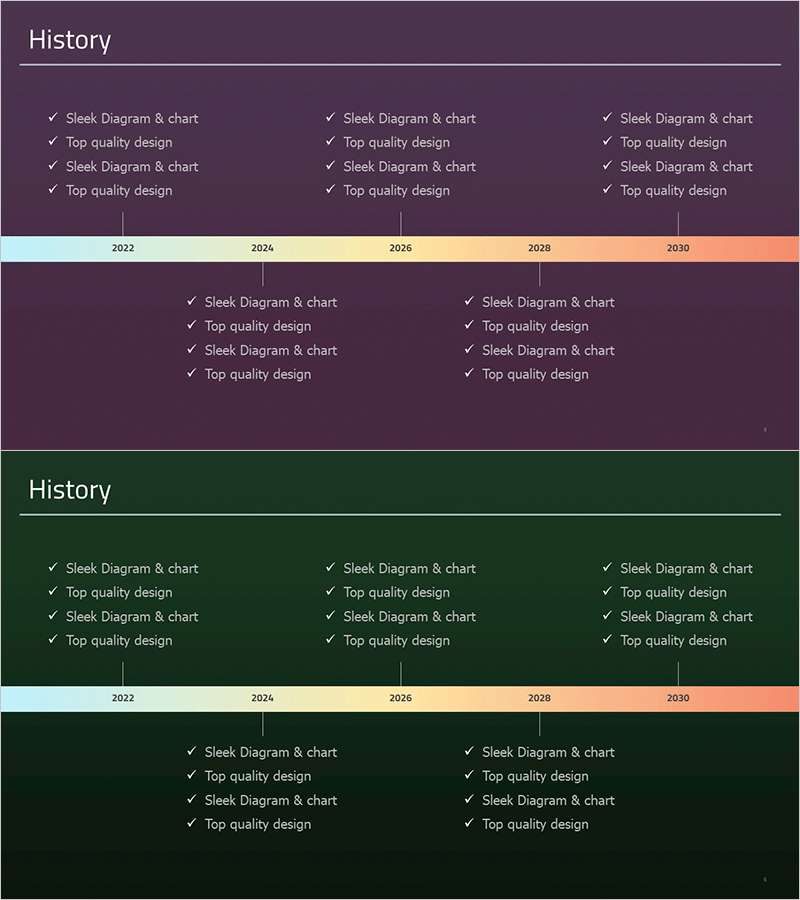
A professional timeline history diagram PowerPoint slide that visually represents your company's key milestones and growth journey from 2022 to 2030. Five major nodes are strategically positioned along a horizontal timeline, each with checkmark fields to document achievements such as Sleek Diagram & chart and Top quality design. The gradient background transitions smoothly from light blue to coral orange, creating an intuitive visual representation of time progression. Text areas positioned above and below the timeline allow detailed descriptions for each milestone period. This slide deck is ready to use in company introduction presentations, business reports, organizational development showcases, and investor pitch decks.
Usage Points
-
Main Usage
Communicate your company's growth trajectory and key achievements in chronological order, helping audiences understand your organizational development at a glance. The checkmark fields emphasize completed milestones and accomplishments, reinforcing credibility and transparency in your corporate narrative.
-
How to Use
Enter your company's major events or achievements in each timeline node (2022, 2024, 2026, 2028, 2030). Add detailed descriptions in the text areas above and below the timeline. Customize colors to match your brand identity. Use in company overview presentations, annual reports, investor relations meetings, and organizational milestone showcases.
-
Recommended For
Corporate executives, marketing managers, business development teams, investor relations professionals, and organizational development departments. Ideal for any presentation where company growth story and historical achievements need emphasis. Particularly effective for employee onboarding, shareholder meetings, and client confidence-building presentations.
-
Slide Structure
2-slide set. First slide features a deep purple background with 5 timeline nodes (2022–2030) and 4 checkmark fields per node. Second slide uses dark green background with identical structure for presentation variety. Gradient color bar (blue to coral) emphasizes time progression. 16:9 widescreen format optimized for modern presentation environments and digital displays.
Related Products
-

Business History Diagram – Visualizing Organizational Growth
#Company Introduction #Diagram #History
-

Portfolio Profile Slide – Company Timeline and Cluster
#Company Introduction #Diagram #History
-

Business Connection Diagram – Cluster and History
#Company Introduction #Diagram #Company Overview
-

Fountain Pen History Diagram – Emphasizing Corporate Identity
#Company Introduction #Product/Service Introduction #Diagram
