Analysis Table of Awards by Year – Data-Driven Insights
RM0300017_21
- Last Update 02/11/2025
- File Size 0.6MB
- # of Slides 2
- File Format PPTX
- Slide Ratio 16:9
- Color
Keywords
- #Content-Based Slides
- #Design-Based Slides
- #Company Introduction
- #Diagram
- #Awards and Certifications, and Patents
- #Cluster
- #Table
- #Closed Cluster Diagram
- #Standard Table
- #16:9
- #awards analysis table PowerPoint
- #year-over-year comparison slide
- #data visualization template
- #corporate performance table
- #annual achievement chart
About the Product
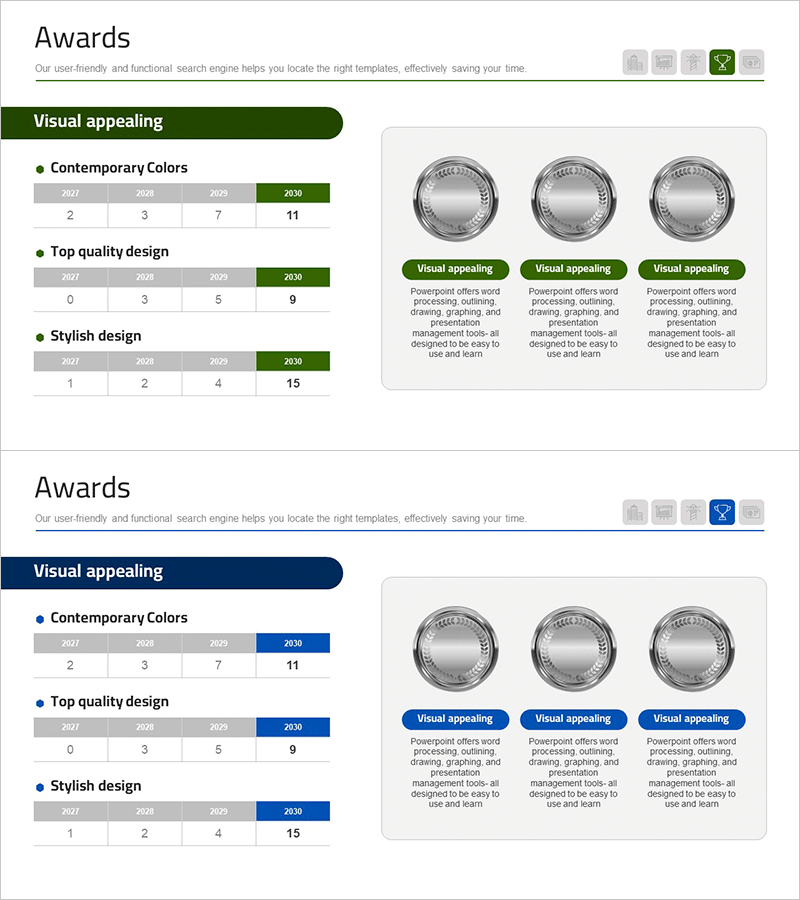
A table-format PowerPoint slide that enables clear year-over-year comparison of awards and recognition data. This presentation template visualizes award achievements from 2027 through 2030 in a structured row-and-column layout, delivering data-driven insights effectively for corporate performance presentations, annual reports, and investor briefings. The design features a green accent header row and gray data cells that highlight key information while maintaining clear input areas for immediate editing. The 16:9 widescreen format across 2 slides integrates seamlessly into your presentation flow, allowing you to showcase organizational growth and credibility through objective metrics.
Usage Points
-
Main Usage
Designed to present year-over-year awards and recognition data in a structured, data-driven format. This slide effectively communicates organizational achievements to investors, employees, and stakeholders, serving as a credibility tool in annual reports, investor presentations, and executive briefings.
-
How to Use
Enter award counts, prize amounts, or achievement metrics in each table cell. Add years (2027–2030) in the green header row and award categories in the left gray column, then populate data cells. The template maintains consistent styling while allowing you to update only the numerical values, preserving the professional appearance.
-
Recommended For
Ideal for executive teams, investor relations departments, marketing teams, and HR professionals presenting corporate achievements. Particularly effective in annual performance reports, investor pitch decks, recruitment presentations, and stakeholder communications where objective, data-backed evidence of organizational success is essential.
-
Slide Structure
Two-slide set featuring a 4-column (2027, 2028, 2029, 2030) by 3-row table structure. Green accent headers and gray data cells create clear visual hierarchy and information distinction. The 16:9 widescreen format ensures compatibility with modern presentation environments and professional display standards.
Related Products
-

Business Idea Service Roadmap – Business Strategy
#Business Strategy #Operational Plan #Diagram
-

List of Patents and Certificates – Visualizing Company Achievements
#Company Introduction #Diagram #Other
-

Award Certification Record Sheet – Achievements and Trust
#Company Introduction #Diagram #Awards and Certifications, and Patents
-

Key Financial Indicators Table – Essential Information Visualization
#Financial Plans and Performance #Diagram #Income Statement
