Introduction to Healthcare Business Services – Utilizing Cluster Diagram
RM0300017_15
- Last Update 02/11/2025
- File Size 2.1MB
- # of Slides 2
- File Format PPTX
- Slide Ratio 16:9
- Color
Keywords
- #Content-Based Slides
- #Design-Based Slides
- #Product/Service Introduction
- #Diagram
- #Product/Service Introduction
- #Features
- #Cluster
- #Closed Cluster Diagram
- #16:9
- #cluster diagram PowerPoint
- #healthcare service overview slide
- #nested diagram template
- #business structure diagram
- #relationship chart PPT template
About the Product
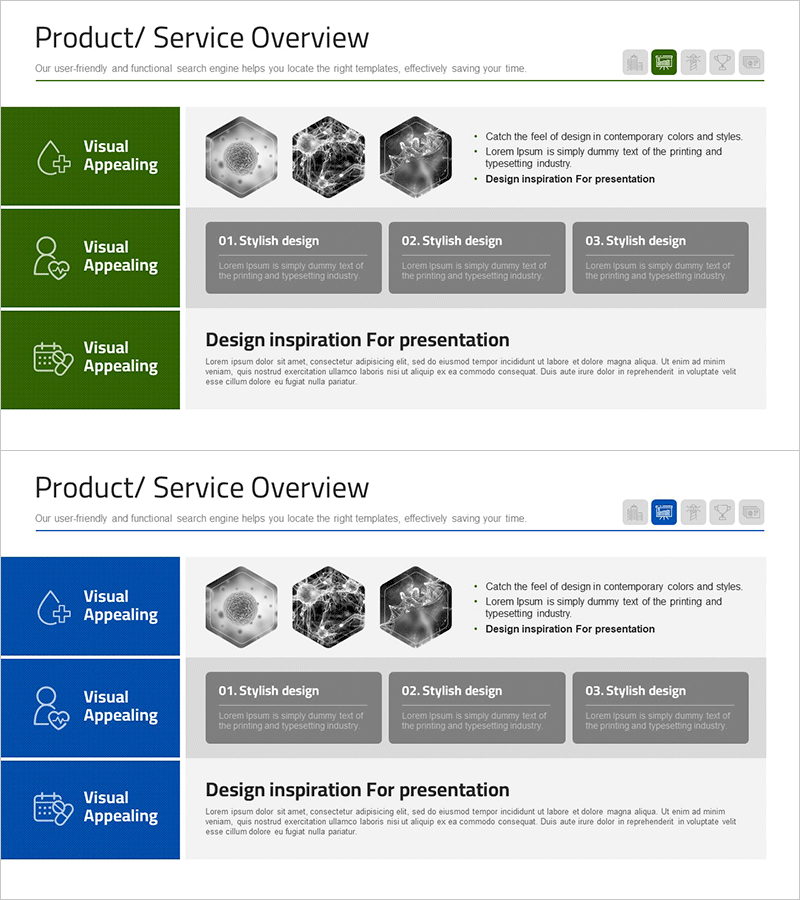
A PowerPoint slide template that visualizes the core services of healthcare business using a 3-node nested cluster diagram. The design features a minimalist background in green and gray tones with hexagonal geometric elements and icons to intuitively represent service relationships and hierarchies. The 2-slide set enables both overview explanation and detailed analysis, making it immediately applicable to medical, pharmaceutical, biotech, and healthcare presentations and business proposals. Available in 16:9 widescreen PPTX format, fully editable in all PowerPoint versions.
Usage Points
-
Main Usage
Expresses the core service areas of healthcare business through a nested node structure, enabling audiences to understand service relationships and hierarchical organization at a glance. Functions as a data visualization tool for business overview presentations, organizational structure introductions, and service portfolio demonstrations.
-
How to Use
Present the overall service structure as an overview on the first slide, then explain detailed content for each node on the second slide. Input actual service names and descriptions in the text fields, and customize colors and icons as needed to align with brand guidelines.
-
Recommended For
Ideal for business briefings, investor pitch presentations, and new service launch events at hospitals, pharmaceutical companies, biotech startups, and healthcare consulting firms. Particularly effective when executives, medical professionals, and sales teams need to communicate complex service structures clearly.
-
Slide Structure
2-slide composition. The first slide presents the overall service structure through a 3-node nested cluster diagram with icons and text input areas at each node. The second slide repeats the same structure to allow detailed explanations for each service area. Widescreen 16:9 format.
Related Products
-

Diagram Slide Explaining Structure and Function of Plants
#Product/Service Introduction #Diagram #Product/Service Introduction
-

Interior Service Overview Presentation Template - Innovation and Trust
#Product/Service Introduction #Diagram #Product/Service Introduction
-

Color Paint and Text Boxes – Eye-Catching Slide for Product Introduction
#Product/Service Introduction #Diagram #Product/Service Introduction
-

Business Characteristics Diagram – Visualizing Product and Service Features
#Product/Service Introduction #Diagram #Product/Service Introduction
