History Icon Diagram – Growth and Development
RM0300012_5
- Last Update 02/10/2025
- File Size 4.3MB
- # of Slides 2
- File Format PPTX
- Slide Ratio 16:9
- Color
Keywords
- #Content-Based Slides
- #Design-Based Slides
- #Company Introduction
- #Product/Service Introduction
- #Diagram
- #History
- #Program Introduction
- #Flow
- #Linear Flow
- #16:9
- #history diagram PowerPoint
- #4-stage timeline slide
- #company milestone presentation
- #growth process diagram
- #linear timeline template
- #how to create timeline in PowerPoint
About the Product
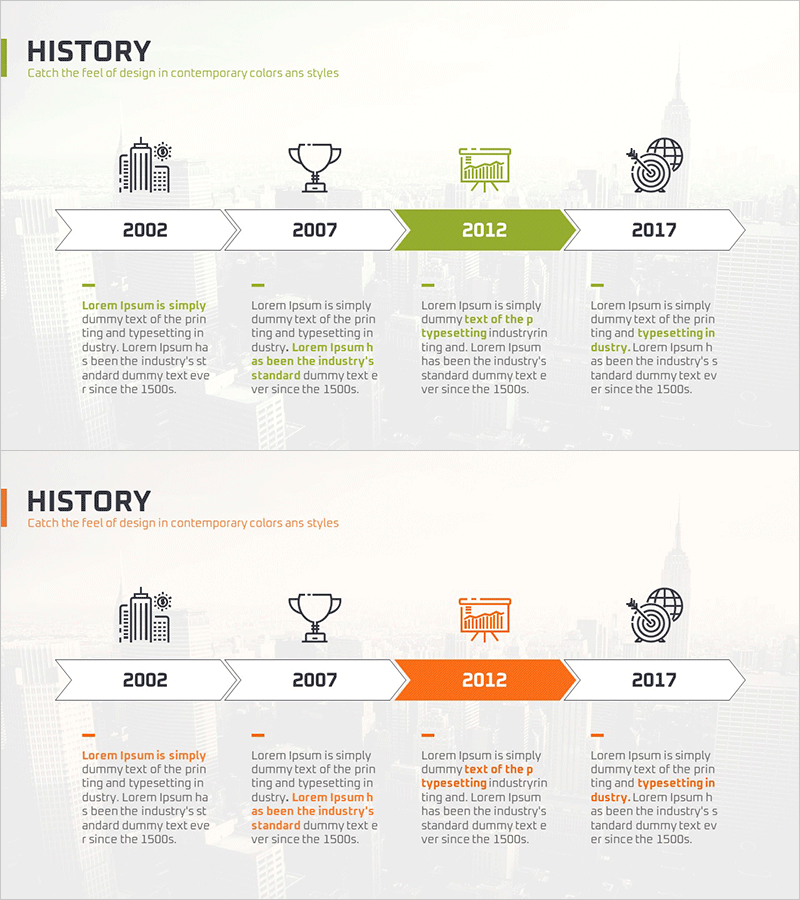
A 4-stage history icon diagram PowerPoint slide that visually represents company milestones and growth trajectory from 2002 to 2017. Each stage features distinct icons—building, trophy, chart, and global network—with dedicated text areas for descriptions. Available in two color versions: green and orange, allowing flexible brand alignment. The left-to-right arrow timeline structure clearly conveys chronological progression and causality. Ideal for company profile presentations, annual reports, investor pitches, and organizational history documentation.
Usage Points
-
Main Usage
Communicate corporate growth stages and company history in chronological order, enabling audiences to grasp the organization's development trajectory at a glance. Icons and text areas highlight key achievements and milestones, while the linear arrow structure intuitively conveys temporal flow and cause-effect relationships.
-
How to Use
Deploy in company profile presentations (history section), annual business reports, investor relations materials, and employee onboarding training. Customize by entering dates, key events, and accomplishments in each text area. Icons can be replaced to match industry-specific contexts or corporate branding.
-
Recommended For
Corporate marketing and communications professionals, executive report writers, HR training coordinators, investor relations specialists, management consultants. Suitable for any presentation scenario requiring emphasis on organizational growth narrative.
-
Slide Structure
Four-node left-to-right arrow timeline (2002, 2007, 2012, 2017). Each node displays a distinct icon (building, trophy, chart, globe). Four text input areas positioned below nodes. Two versions provided: green-accent and orange-accent.
Related Products
-

History of Past Businessmen Presentation Template - Visualizing the Flow of Time
#Company Introduction #Product/Service Introduction #Diagram
-

Simple PowerPoint Wide Template History
#Company Introduction #Diagram #History
-

Water Resources History Presentation Template
#Company Introduction #Business Strategy #Diagram
-

Business Illustration Theme History – Flow Towards a Better Future
#Company Introduction #Diagram #History
