Target Market Entry Analysis Graph
RM0300012_11
- Last Update 02/10/2025
- File Size 1.5MB
- # of Slides 2
- File Format PPTX
- Slide Ratio 16:9
- Color
Keywords
- #Content-Based Slides
- #Design-Based Slides
- #Company Introduction
- #Marketing Plan and Strategy
- #Graph
- #Other
- #Global Network
- #Target Market Strategy
- #Map
- #16:9
- #global network map PowerPoint slide
- #world map data visualization PPT
- #regional percentage chart slide
- #market entry analysis presentation
- #international business map template
About the Product
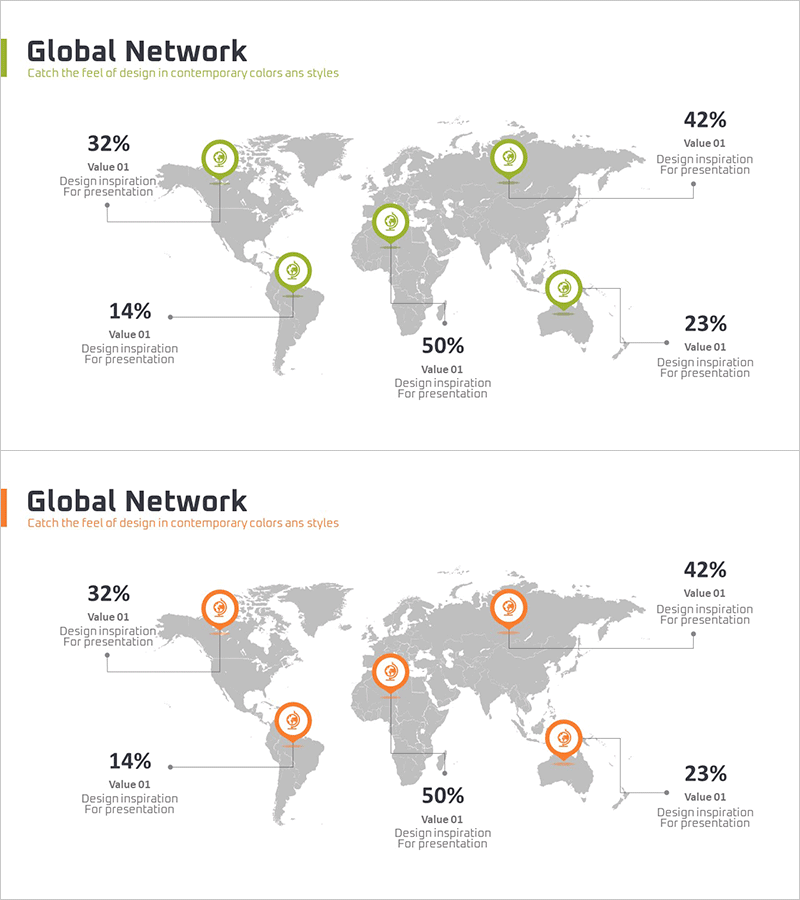
A PowerPoint slide featuring a world map with five regional data points displayed as circular icons showing percentage values. The slide comes in two color versions—green and orange accents—on a gray map background, enabling quick regional comparison. Ideal for global business presentations, market entry analysis, regional performance reports, and international expansion strategies. The 16:9 widescreen format includes 2 slides in PPTX format with fully editable text and numerical data fields for immediate customization.
Usage Points
-
Main Usage
Visualize regional market share, sales distribution, or performance metrics across five global regions on a world map. Effectively communicate geographic business expansion, international market analysis, and regional comparisons to stakeholders, investors, and team members.
-
How to Use
Replace the sample percentage values with your actual regional data. Customize region labels and descriptive text as needed. Select either the green or orange color version to match your corporate branding. Insert into your presentation deck for immediate use in reports or investor pitches.
-
Recommended For
Global business executives, marketing strategists, business development teams, international market analysts, investment relations professionals, and sales leaders presenting regional performance or market expansion strategies.
-
Slide Structure
Two-slide set with identical layouts in contrasting color schemes. Each slide contains a world map background, five regional marker positions with circular icons, percentage value fields, and text annotation areas for region names and supporting details.
Related Products
-

Global Network Analysis Chart – Visualizing Target Market Strategy
#Company Introduction #Marketing Plan and Strategy #Graph
-

Global Distribution Analysis Chart – Visualizing Marketing Strategies
#Company Introduction #Marketing Plan and Strategy #Graph
-

Startup Business Global Market Strategy – Market Analysis and Goal Setting
#Company Introduction #Marketing Plan and Strategy #Graph
-

Global Network Distribution Analysis – Visualizing Market Strategy
#Company Introduction #Marketing Plan and Strategy #Graph
