Global Network Analysis Chart – Visualizing Target Market Strategy
RM0200010_7
- Last Update 02/04/2025
- File Size 0.8MB
- # of Slides 2
- File Format PPTX
- Slide Ratio 16:9
- Color
Keywords
- #Content-Based Slides
- #Design-Based Slides
- #Company Introduction
- #Marketing Plan and Strategy
- #Graph
- #Other
- #Global Network
- #Target Market Strategy
- #Horizontal Bar
- #Horizontal Bar Chart
- #Map
- #16:9
- #world map PowerPoint slide
- #global network diagram
- #market analysis chart
- #international business presentation
- #regional performance graph
- #network visualization slide
About the Product
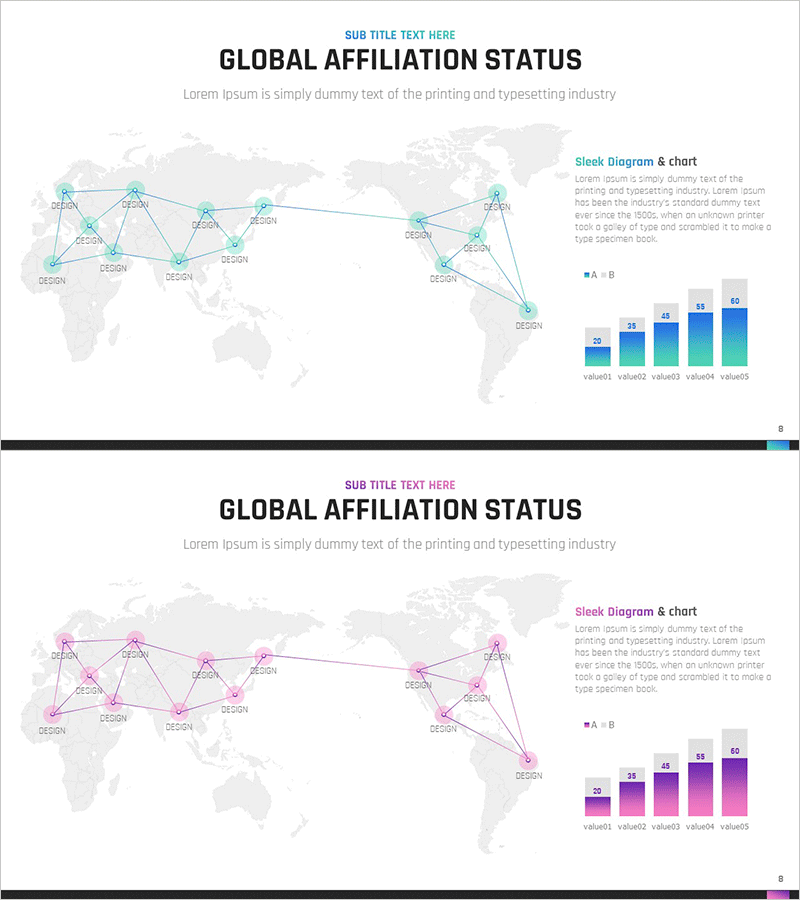
A comprehensive PowerPoint slide template for visualizing global market strategy and international business networks using a world map foundation. Key regions are represented as nodes with connecting lines showing relationships and interdependencies across markets. Paired with a horizontal bar chart displaying regional performance metrics, this design enables comparative analysis of market penetration, sales distribution, and growth indicators. The consistent teal color scheme conveys professionalism and clarity, making it ideal for marketing plans, business reports, investor presentations, and strategic planning documents. Two-slide set includes color variations (teal and pink) allowing customization to match corporate branding guidelines.
Usage Points
-
Main Usage
Communicate international market expansion strategies, global partnership networks, regional sales performance, and market growth plans to executives and investors through map-based visual representation that clarifies complex global operations.
-
How to Use
Mark key business locations as nodes on the world map and connect them with lines representing business relationships. Input regional data (sales, customer count, market share) into the horizontal bar chart on the right side to create a comprehensive comparative analysis of market performance across territories.
-
Recommended For
Marketing managers, business development teams, executives preparing reports, investor relations professionals, and international strategy teams who need to present global market conditions and growth strategies with compelling visual evidence and clear data comparison.
-
Slide Structure
Slide 1: Teal-toned world map network diagram with 8-10 connected nodes representing key markets, paired with horizontal bar chart comparing 5 regional metrics. Slide 2: Identical layout in pink color variation. 16:9 widescreen format optimized for large-scale presentations and digital displays.
Related Products
-

Country-by-country Yield Analysis Map for Global Business Strategy
#Company Introduction #Marketing Plan and Strategy #Graph
-

Global Target Market Goals – Visualization of Market Strategy
#Company Introduction #Marketing Plan and Strategy #Other
-

Startup Business Global Market Strategy – Market Analysis and Goal Setting
#Company Introduction #Marketing Plan and Strategy #Graph
-

Global Key Market Map – Market Access Strategy
#Company Introduction #Marketing Plan and Strategy #Other
