Tarpaulin Connection Diagram – A New Perspective on Business Introduction
RM0300008_13
- Last Update 02/08/2025
- File Size 9.2MB
- # of Slides 2
- File Format PPTX
- Slide Ratio 16:9
- Color
Keywords
- #Content-Based Slides
- #Design-Based Slides
- #Company Introduction
- #Business Introduction
- #Diagram
- #Business Areas
- #Business Areas
- #Cluster
- #Chain Diagram
- #16:9
- #connection diagram PowerPoint
- #cluster diagram slide
- #4-node relationship map
- #business structure diagram
- #how to create connection diagram in PowerPoint
About the Product
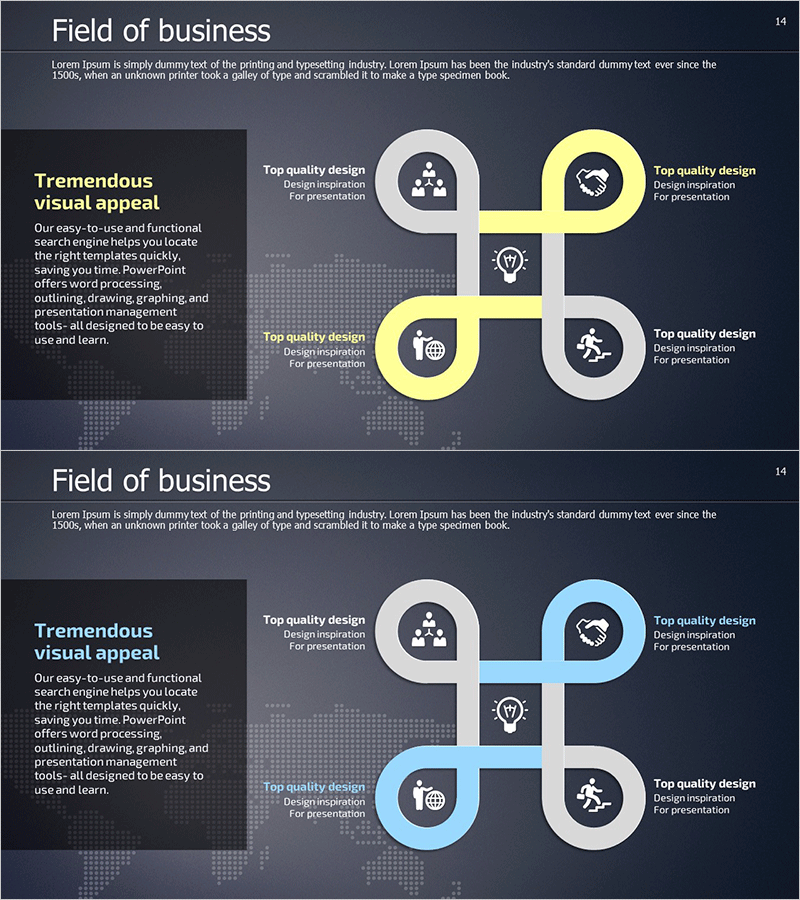
A cluster diagram PowerPoint slide connecting four nodes through central lines, ideal for visualizing business relationships and interactions. Designed with a dark background and white/yellow accent lines on the first slide, light blue accents on the second. Each node features an icon (team, idea, global, execution) representing key business elements. The 2-slide set accommodates diverse presentation scenarios including business introductions, strategic planning, organizational structures, and project frameworks. Fully editable in 16:9 format, enabling quick customization for various corporate presentations and stakeholder communications.
Usage Points
-
Main Usage
Clearly illustrate the interconnection and relationships among four key business elements (team, idea, global, execution) in corporate presentations. Effectively convey complex relationships in business introductions, strategic planning, organizational structures, and project proposals through intuitive visual representation.
-
How to Use
Customize node text and icons to match your presentation topic. Use the yellow-accent version for dynamic, positive-toned presentations emphasizing growth and action. Apply the light-blue-accent version for trust-focused, stability-oriented business communications. Highlight inter-element relationships through the central connecting lines.
-
Recommended For
Ideal for executives, planning teams, marketing departments, and project leaders presenting business strategies, organizational roles, market expansion plans, and product development processes. Suitable for investor pitch decks, company introductions, new business proposals, organizational restructuring announcements, and cross-functional team communications.
-
Slide Structure
Four nodes arranged in cardinal positions (top, bottom, left, right) around a central intersection point. Each node contains a circular background with icon and text area. Central connecting lines (white/yellow on slide 1, white/light blue on slide 2) link all nodes. Both slides maintain identical structure with color variation for presentation flexibility.
Related Products
-

Diffusion Diagram with Center for Business Area Presentation
#Company Introduction #Business Introduction #Diagram
-

Space Industry Diffusion Diagram – Innovative Business Model Introduction
#Company Introduction #Business Introduction #Diagram
-

Internet of Things Service Area Diagram – Business Introduction and Visualization
#Company Introduction #Business Introduction #Diagram
-

Writing Instrument Pie Diagram – Business Introduction Slide
#Company Introduction #Business Introduction #Diagram
