Future Technology Industry Market Positioning Map
RM0200015_16
- Last Update 02/05/2025
- File Size 0.8MB
- # of Slides 2
- File Format PPTX
- Slide Ratio 16:9
- Color
Keywords
- #Content-Based Slides
- #Design-Based Slides
- #Market and Competitor Analysis
- #Marketing Plan and Strategy
- #Graph
- #Other
- #Competitor Analysis
- #Positioning
- #16:9
- #market positioning map PowerPoint
- #positioning map slide
- #2-axis bubble chart PPT
- #competitive analysis slide
- #how to create positioning map in PowerPoint
About the Product
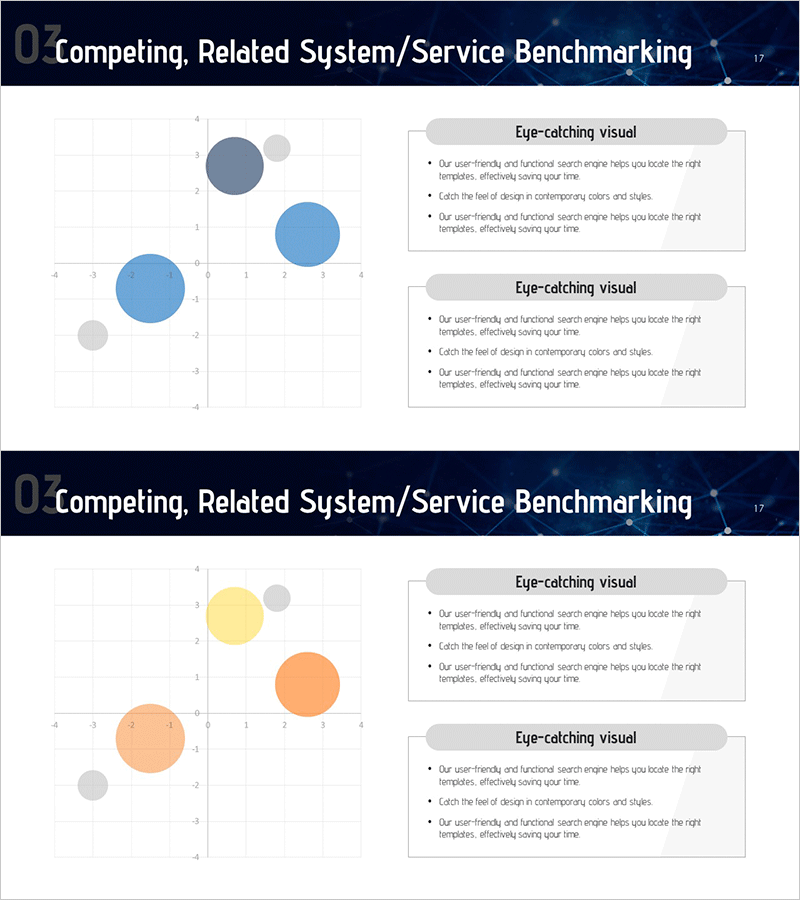
A two-axis bubble chart PowerPoint slide designed for competitive analysis and market positioning visualization. Set against a dark blue background, blue, orange, and yellow bubbles represent the relative market positions of products and services. Bubble size indicates market scale, while X and Y axis labels define comparison criteria. Two text boxes on the right side provide space for key insights and strategic commentary. This layout is optimized for technology industry presentations, new business strategy pitches, and investor relations materials, enabling immediate use in executive briefings and business planning reports.
Usage Points
-
Main Usage
Visualizes a new product or business unit's market position relative to competitors using two comparison dimensions (price vs. quality, technology vs. market share, etc.). Bubble size simultaneously communicates market scale or revenue, enabling investors and executives to grasp strategic positioning at a glance.
-
How to Use
Customize X and Y axis labels to match your product categories and competitive benchmarks. Adjust bubble positions, sizes, and colors according to your data. Fill the right-side text boxes with key strategic insights, opportunities, or risk factors. Insert into the market analysis section of business plans, pitch decks, or executive reports.
-
Recommended For
New business development teams, marketing strategists, investor relations professionals, and executives preparing market analysis reports. Ideal for technology companies, startups, and product launch initiatives explaining market entry strategies.
-
Slide Structure
Dark blue background with X-Y axis grid on the left side containing three sized bubbles (blue, orange, yellow). Right side features two text boxes labeled 'Key Insights' with three-line input areas each. Fully editable across all elements including colors, bubble dimensions, and text content.
Related Products
-

Competitive Market Comparison & Positioning Map - Effective Market Analysis
#Market and Competitor Analysis #Marketing Plan and Strategy #Graph
-

Analysis of Key Competitor Positioning to Enhance Market Competitiveness
#Market and Competitor Analysis #Marketing Plan and Strategy #Diagram
-

Market Environment Analysis Graph – Deriving Competitive Advantage and Strategy
#Market and Competitor Analysis #Marketing Plan and Strategy #Graph
-

Simple Positioning Map – Visualizing Marketing Strategy
#Marketing Plan and Strategy #Graph #Other
