Filming Progress Status Analysis Graph – Clear Marketing Strategy Visualization
RM0200014_18
- Last Update 02/05/2025
- File Size 1.3MB
- # of Slides 2
- File Format PPTX
- Slide Ratio 16:9
- Color
Keywords
- #Content-Based Slides
- #Design-Based Slides
- #Product/Service Introduction
- #Marketing Plan and Strategy
- #Diagram
- #Graph
- #Other
- #Development Status
- #Marketing Strategy
- #Spread
- #Decentralized Diagram
- #16:9
- #radial diagram PowerPoint slide
- #central expansion diagram
- #6-item relationship chart
- #strategy direction visualization
- #marketing analysis slide
- #how to create radial diagram in PowerPoint
- #PowerPoint diagram template download
About the Product
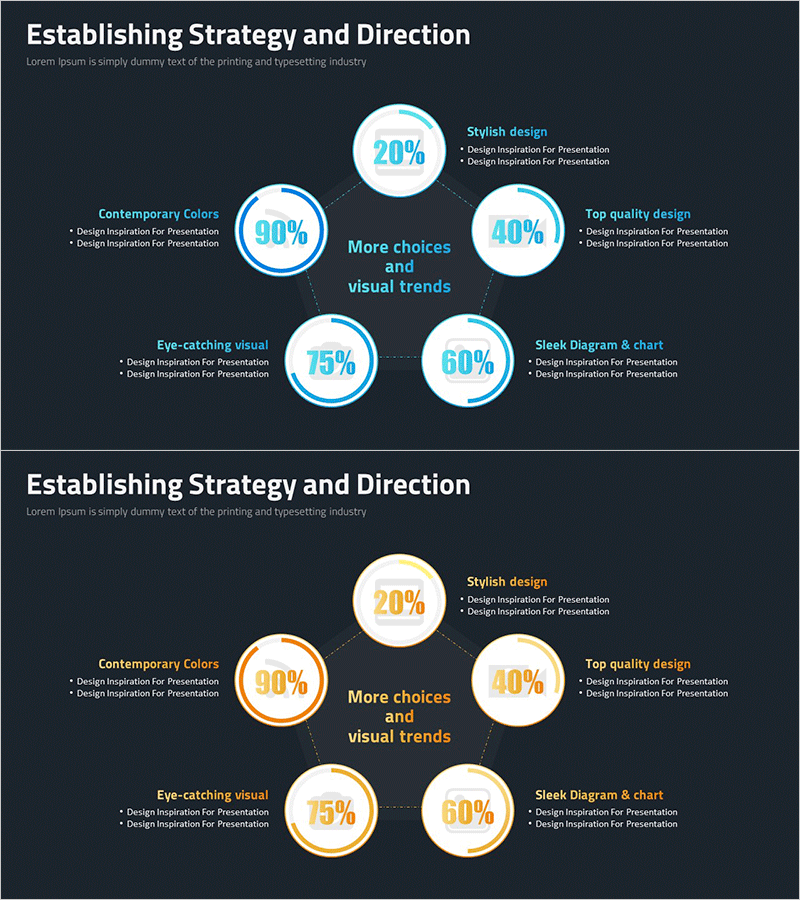
A radial diagram PowerPoint slide that expands from center to periphery, ideal for strategy presentations and analysis visualization. The design features a central concept node connected to six surrounding items in a circular arrangement, perfect for illustrating strategic direction, current status analysis, and marketing initiatives. Light cyan-colored circular nodes with dotted connector lines create clear visual hierarchy, with dedicated text description areas for each item. This 2-slide 16:9 widescreen presentation template is ready for immediate use in modern business environments.
Usage Points
-
Main Usage
Visually communicates the relationship between a core concept and multiple related items through radial expansion, effectively demonstrating the central theme's influence and scope. Ideal for strategy presentations where core direction and detailed execution items must be presented simultaneously, and for marketing analysis where key metrics and supporting elements need clear relational context.
-
How to Use
Enter your core topic (e.g., marketing strategy, business direction) in the central circular node. Populate the six surrounding items with strategic initiatives, implementation tasks, or performance indicators. Double-click text areas to edit content, and modify node colors as needed to distinguish priorities or categories.
-
Recommended For
Marketing professionals, strategy planning teams, project managers, and sales leaders presenting strategy development, status reports, and directional initiatives. Particularly effective for executive briefings, team meetings, and client presentations where multiple execution items must be communicated alongside a central objective.
-
Slide Structure
Features one large central circular node (core topic) with six equally-sized circular nodes arranged in cardinal and intercardinal directions (top, top-right, bottom-right, bottom, bottom-left, top-left). Each node connects to the center via dotted lines, with text description areas positioned to the right of each item. Light cyan gradient circles with white borders emphasize the nodes.
Related Products
-

Online Business Marketing Strategy – Data-Driven Decision Making
#Product/Service Introduction #Marketing Plan and Strategy #Graph
-

Three-Dimensional Graph Analysis – Market and Competitor Analysis Slide
#Product/Service Introduction #Market and Competitor Analysis #Marketing Plan and Strategy
-

Infographic Slide for Performance Analysis – Clear Visualization
#Product/Service Introduction #Business Introduction #Graph
-

Visualizing Experimental Results with Bar Chart Slide
#Product/Service Introduction #Market and Competitor Analysis #Graph
