Global Target Market Goals – Visualization of Market Strategy
RJ0300030_13
- Last Update 04/26/2025
- File Size 1.4MB
- # of Slides 2
- File Format PPTX
- Slide Ratio 16:9
- Color
Keywords
About the Product
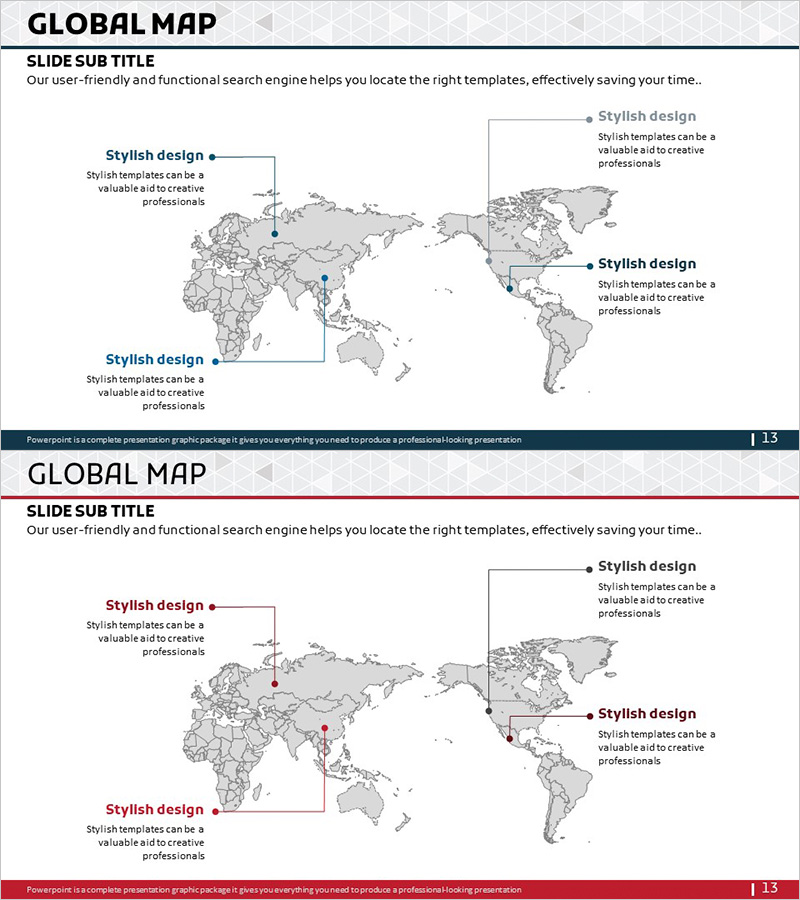
A PowerPoint slide that visualizes global networks, target markets, and marketing strategies using a world map background. The gray-toned world map features three blue or red marker points positioned to highlight key regions, business hubs, and target markets. Each marker connects to text boxes and description areas, enabling clear communication of regional strategies, business objectives, and partnership information. This 16:9 widescreen 2-slide set integrates seamlessly into company presentations, business plans, marketing proposals, and investor pitch decks for immediate use.
Usage Points
-
Main Usage
Visualize global business expansion, international market entry strategies, and multinational partnerships using map-based graphics. Communicate regional objectives and business scope clearly to investors, partners, and stakeholders. Help audiences grasp the company's global footprint and market expansion roadmap at a glance.
-
How to Use
Input key business hubs, target markets, or regional operations at the three marker positions. Fill in region names, business descriptions, partner companies, and target metrics in the adjacent text boxes to detail regional strategies. Use in company profile global network sections, business plan market entry strategies, and investor presentation business scope overviews.
-
Recommended For
Global expansion company executives, marketing and sales teams, international proposal writers, investment pitch presenters, multinational project managers, and overseas partnership negotiators who need to clearly communicate regional business objectives and market strategies.
-
Slide Structure
Two-slide set, each featuring a world map background with three marker points and text input areas. The first slide uses blue markers while the second uses red markers, allowing comparison of different strategies, objectives, or scenarios. Each marker connects via arrows to text boxes, creating clear information hierarchy and enabling region-by-region data entry.
Related Products
-

Global Target Country Analysis Slide
#Company Introduction #Marketing Plan and Strategy #Diagram
-

Global Network and Market Strategy - Optimal Business Approaches
#Company Introduction #Marketing Plan and Strategy #Diagram
-

Regional Distribution Chart for Global Marketing Strategy
#Company Introduction #Marketing Plan and Strategy #Other
-

Setting Global Target Regional Strategies – Visualized with Sleek Diagrams and Clusters
#Company Introduction #Marketing Plan and Strategy #Diagram
