Service Benchmarking Table – Effective Service Operations
RM0200005_16
- Last Update 02/02/2025
- File Size 0.3MB
- # of Slides 2
- File Format PPTX
- Slide Ratio 16:9
- Color
Keywords
About the Product
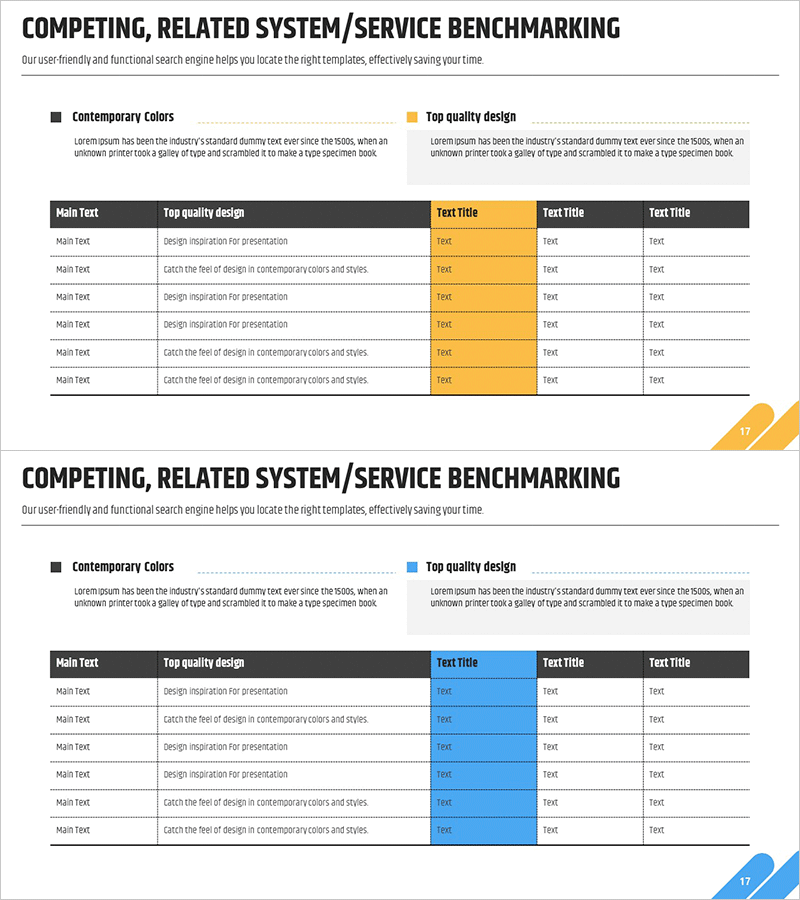
A PowerPoint benchmarking table slide that enables side-by-side comparison of competing and related services across functionality, quality, and operational metrics. Features two color-coded layout options—yellow and blue accent cells—allowing flexible adaptation to different presentation styles. The clear information structure with a left-aligned 'Key Criteria' column and right-aligned 'Data Entry' fields facilitates effective communication of service operations, execution strategies, and quality standards. Includes 2 slides in 16:9 aspect ratio, ready for immediate editing and deployment.
Usage Points
-
Main Usage
Objectively compare competing and related services across functionality, quality, pricing, and service levels to identify organizational strengths and competitive gaps. Supports service operations planning, strategic decision-making, and stakeholder communication regarding service differentiation and improvement priorities.
-
How to Use
Enter comparison criteria (features, quality metrics, pricing, customer satisfaction, etc.) in the left 'Key Criteria' column. Input service-specific evaluation data in the right text fields. Use yellow or blue accent cells to highlight critical comparison points, and select the color layout that best matches your presentation's overall design tone.
-
Recommended For
Service planning and operations teams conducting competitive analysis presentations, executive-level service strategy briefings, investor and partner pitches emphasizing service differentiation, and cross-functional team discussions on service improvement initiatives.
-
Slide Structure
2-slide set with 16:9 aspect ratio. Each slide features a black header section (title and description area) and a 6-row × 3-column table structure. Slide 1 uses yellow accent cells; Slide 2 uses blue accents, providing design flexibility to match your overall presentation aesthetic.
Related Products
-

Gardening System - Effective Service Operation Diagram
#Technical Approach #Diagram #Service Operation Plan
-

Introduction to the Sea Package Program - Marine Service Operations Strategy
#Technical Approach #Diagram #Service Operation Plan
-

Creative Idea Diagram – Technology Strategy and Service Operations
#Technical Approach #Diagram #Service Operation Plan
-

Round Circular Block Diagram – Analysis of Technical Sector Service Operations
#Technical Approach #Diagram #Service Operation Plan
