Total Analysis Results Table Chart – Insights into the Market
RM0200004_17
- Last Update 02/02/2025
- File Size 0.2MB
- # of Slides 2
- File Format PPTX
- Slide Ratio 16:9
- Color
Keywords
- #Content-Based Slides
- #Design-Based Slides
- #Market and Competitor Analysis
- #Customer Success Stories
- #Diagram
- #Market Analysis
- #Customer Testimonials and Feedback
- #Table
- #16:9
- #analysis results table PowerPoint
- #data comparison slide design
- #market analysis table PPT
- #business analysis template
- #5-column comparison slide
About the Product
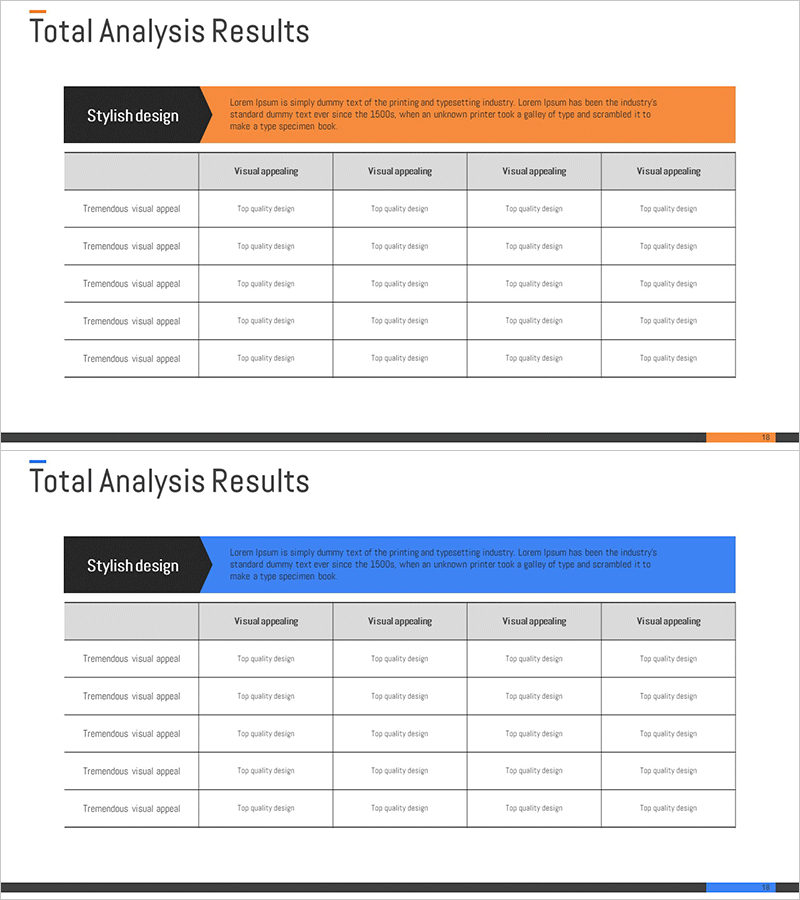
A professional data visualization PowerPoint slide designed for market analysis and business decision-making. Features a black header with orange accent bar and a 5-column comparison table layout that clearly presents analytical data. Each row accommodates key items such as 'Visual Appeal' and 'Top Quality Design', making it ideal for expressing market conditions, competitive analysis, and customer success stories. The 2-slide set includes both orange and blue color versions, optimized for 16:9 widescreen presentations.
Usage Points
-
Main Usage
Used in executive reports, market analysis presentations, and customer success case sharing to simultaneously compare and evaluate multiple analytical dimensions. Effectively supports decision-making by combining quantitative data with qualitative assessments.
-
How to Use
Enter analysis category names in column headers (e.g., Visual Appeal, Quality, Price Competitiveness), then fill rows with comparison subjects (competitors, products, scenarios). Cell content can be freely edited with text, numbers, or checkmarks. Choose between orange or blue color versions.
-
Recommended For
Ideal for marketing teams' competitive analysis, sales teams' customer success presentations, executive reports' market overview sections, product planning teams' feature comparisons, and consulting firms' client proposals.
-
Slide Structure
2-slide set with Slide 1 featuring orange header and 5-column comparison table, Slide 2 with blue header and identical structure. Each slide includes 1 title area and 1 table with 5 columns × 5 rows, totaling 25 editable data cells.
Related Products
-

Simple PowerPoint Wide Template Evaluation Table - Easily Compare Data
#Market and Competitor Analysis #Customer Success Stories #Diagram
-

Customer Reviews and Feedback Table – A Powerful Tool for Customer Engagement
#Market and Competitor Analysis #Customer Success Stories #Diagram
-

Business Profit Analysis Results – Visualization of Market and Customer Feedback
#Market and Competitor Analysis #Customer Success Stories #Diagram
-

Customer Evaluation and Feedback Analysis Graph – Insights Centered on Customers
#Market and Competitor Analysis #Customer Success Stories #Diagram
