Key Stage Schedule Planning – Visualizing Business Management and Flow
RM0200002_27
- Last Update 02/01/2025
- File Size 0.6MB
- # of Slides 2
- File Format PPTX
- Slide Ratio 16:9
- Color
Keywords
- #Content-Based Slides
- #Design-Based Slides
- #Business Management
- #Operational Plan
- #Diagram
- #Execution Plan
- #Project Implementation Schedule
- #Flow
- #Linear Flow
- #16:9
- #linear diagram PowerPoint
- #4-stage flowchart slide
- #project schedule PowerPoint
- #milestone planning diagram
- #business management PPT slide
About the Product
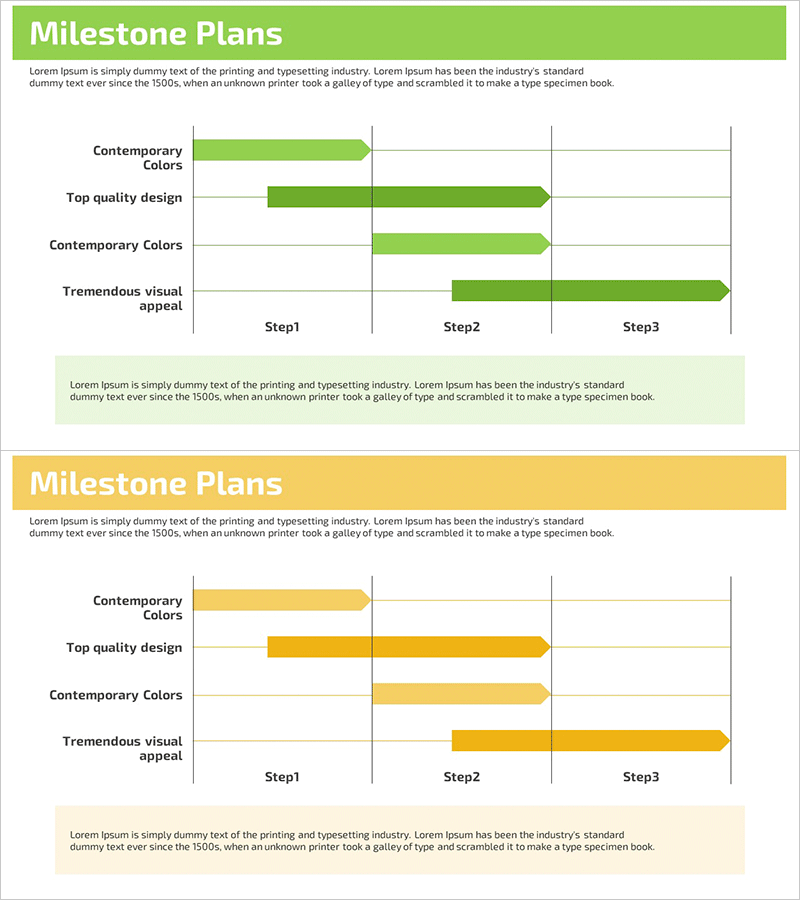
A 4-stage linear diagram PowerPoint slide designed to visualize business management and project progress flow. The arrow-based flowchart progresses sequentially from left to right, allowing you to clearly express each stage's key items and timeline. Two color versions—lime green and yellow—are included, created in 16:9 widescreen format optimized for modern presentation environments. This slide deck is ready to use immediately in various business documents such as operational plans, milestone planning, and project roadmaps.
Usage Points
-
Main Usage
Clearly communicate the entire project timeline and milestones to team members and stakeholders by expressing each stage's progression in chronological order. Add detailed items beneath each stage to specify concrete tasks and responsible parties. Ideal for business management reports, operational planning presentations, and project kickoff meetings.
-
How to Use
Double-click the text area in each stage to enter the stage name (e.g., Step1, Step2, Step3, Step4) and corresponding timeline. In the description area below, input the key activities, deliverables, and responsible departments for each stage. Adjust colors using the theme color feature to match your organization's branding, and freely modify arrow length and node size as needed.
-
Recommended For
Project managers, business planners, operations managers, and executives presenting schedules and progress reports. Suitable for new business initiatives, product development roadmaps, organizational restructuring plans, marketing campaign timelines, and system implementation projects.
-
Slide Structure
Two-slide set featuring 4 sequential nodes (rectangles connected by arrows) on each slide. The linear flow progresses from left to right with text input areas below each node for adding stage names and descriptions. Lime green and yellow versions are provided separately, allowing you to select the version that best matches your presentation topic and organizational image.
Related Products
-

Surgical Gown Theme Plan Schedule – Business Management & Operations Planning
#Business Management #Operational Plan #Diagram
-

Carbon Neutral Arrow Diagram – Effectively Conveying Linear Flow
#Business Management #Diagram #Execution Plan
-

Space Illustration Theme Connection Diagram
#Business Strategy #Business Management #Diagram
-

Sports Flow Strategy Diagram – Step-by-Step Business Plan
#Business Strategy #Business Management #Diagram
