Interior Business Overview PowerPoint – Current State
RM0100019_4
- Last Update 01/31/2025
- File Size 4.2MB
- # of Slides 2
- File Format PPTX
- Slide Ratio 16:9
- Color
Keywords
- #Content-Based Slides
- #Design-Based Slides
- #Company Introduction
- #Business Introduction
- #Diagram
- #Company Overview
- #Business Overview
- #Cluster
- #Closed Cluster Diagram
- #16:9
- #current state analysis diagram PowerPoint
- #4-item metrics slide
- #business overview presentation
- #KPI visualization slide
- #company status PowerPoint template
About the Product
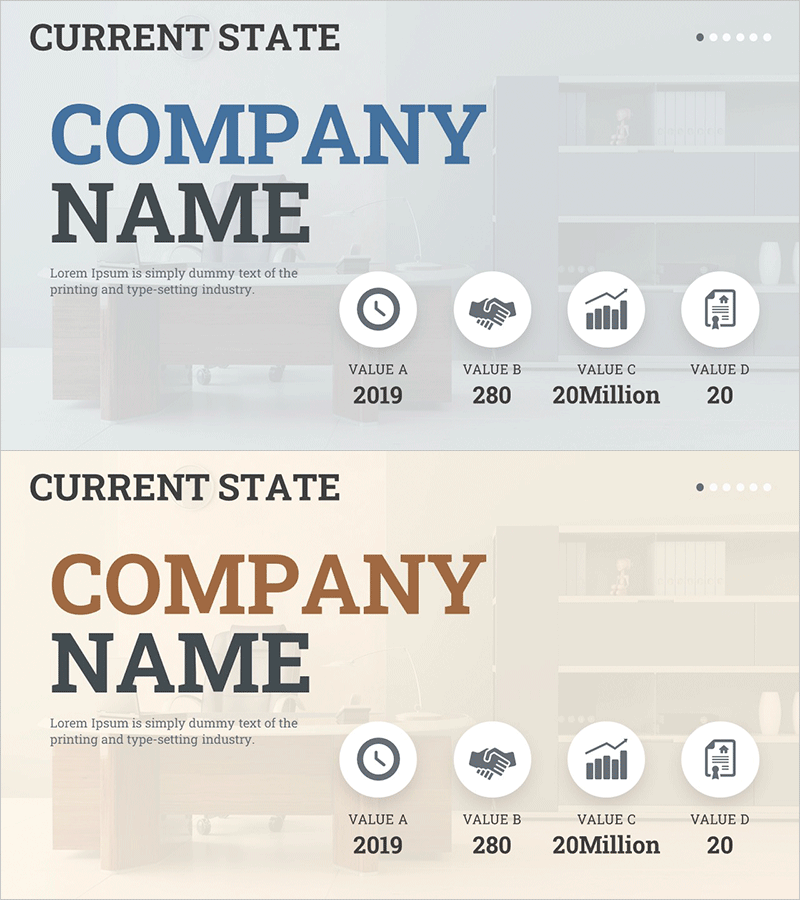
A PowerPoint slide that visualizes business current state through four key performance indicators with circular icons and numerical data. The dual-tone blue and brown color scheme conveys both credibility and stability, while the background imagery and harmonious layout enhance presentation professionalism. This 2-slide deck is immediately applicable to various business presentations including company overviews, business status reports, and investor pitches. Each icon represents a distinct metric, making it easy to communicate key achievements at a glance.
Usage Points
-
Main Usage
Communicates a company's current state through four quantified key metrics (time, partnership, performance, management) to stakeholders. Ideal for company overview presentations, quarterly business status reports, investor relations meetings, and executive briefings where key achievements need clear emphasis.
-
How to Use
Input numerical data beneath each circular icon to represent company metrics, targets, and achievements. Background imagery can be customized by industry, and colors and text are fully editable to match brand identity. The 16:9 widescreen format is optimized for modern projectors and online presentations with full editing capability in PowerPoint.
-
Recommended For
Executive and management presentations, investor relations materials, employee onboarding training, quarterly and annual performance reports. Particularly suited for interior design, construction, real estate, and manufacturing industries where business scale and metrics require numerical visualization.
-
Slide Structure
2-slide deck with left-aligned title area (CURRENT STATE, COMPANY NAME) and right-aligned 4-icon layout. Each circular icon includes a label (VALUE A–D) and data input field, with background imagery and transparent overlay creating depth and visual hierarchy.
Related Products
-

Diagram Slide for Understanding the Medical Industry
#Company Introduction #Business Introduction #Diagram
-

Slide Effectively Showcasing Card Payment Service Configuration
#Company Introduction #Business Introduction #Diagram
-

Pastel Gradient Business Overview – A New Perspective on Business
#Company Introduction #Business Introduction #Diagram
-

IT Financial Services Business Overview – Emphasizing Diagrams
#Company Introduction #Business Introduction #Diagram
