SWOT Analysis Square Diagram – A Useful Template for Market Analysis
RM0100018_23
- Last Update 01/30/2025
- File Size 1MB
- # of Slides 2
- File Format PPTX
- Slide Ratio 16:9
- Color
Keywords
About the Product
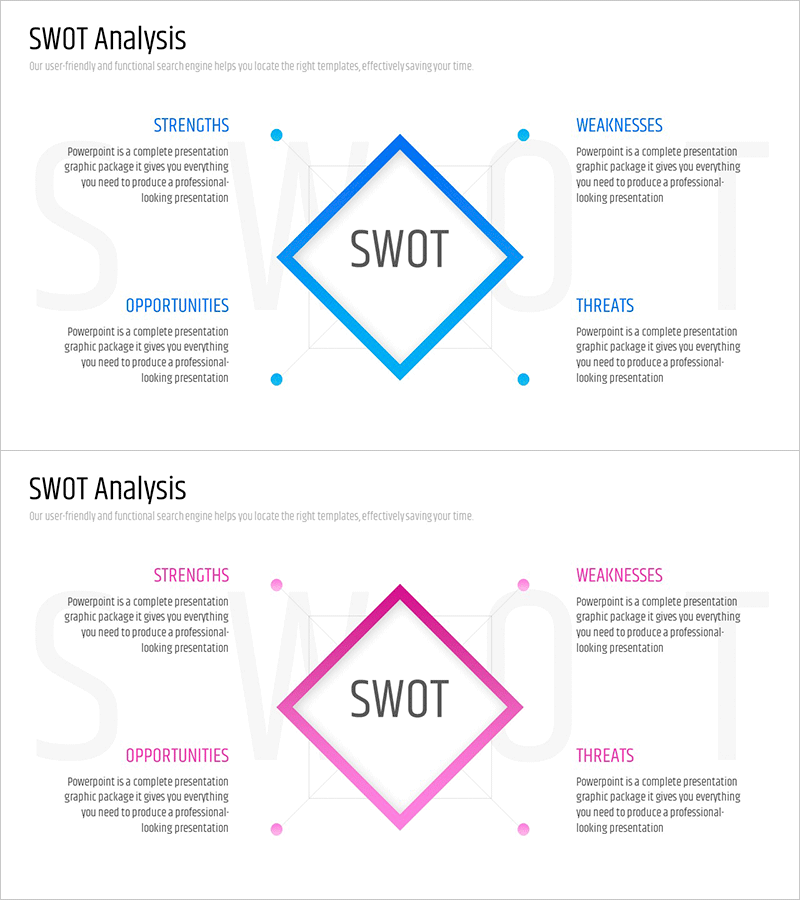
A professional SWOT analysis PowerPoint slide featuring a 4-quadrant diamond diagram centered on a central rhombus shape. The layout clearly separates Strengths, Weaknesses, Opportunities, and Threats into four distinct zones, making it ideal for market analysis and strategic planning presentations. Two color versions—blue and pink—are included, allowing you to match your corporate branding or presentation theme. Each quadrant provides ample text input space for detailed analysis content, and the 16:9 widescreen format ensures compatibility with modern presentation environments. Fully editable PPTX format ready for immediate download and customization.
Usage Points
-
Main Usage
Systematically analyze and visualize organizational strengths, weaknesses, opportunities, and threats for strategic decision-making. The centered diamond structure balances all four quadrants, making it essential for executive strategy sessions, business planning, market entry evaluations, and competitive positioning discussions.
-
How to Use
Enter strengths in the top-left quadrant, weaknesses in the top-right, opportunities in the bottom-left, and threats in the bottom-right. Fill in the text boxes with your analysis findings, then customize colors or add icons as needed. Choose between the blue or pink version based on your presentation theme.
-
Recommended For
Executives, strategy teams, marketing departments, and business development teams presenting market analysis results. Ideal for new business venture assessments, competitive analysis, product launch strategies, organizational capability evaluations, and any strategic decision-making presentation.
-
Slide Structure
2-slide set with identical 4-quadrant diamond layouts. Each slide features a central rhombus with four text input areas positioned at top-left, top-right, bottom-left, and bottom-right. The blue version uses dark blue borders with light blue backgrounds; the pink version features dark pink borders with light pink backgrounds. Formatted in 16:9 widescreen ratio.
Related Products
-

Diamond Overlay SWOT Diagram
#Market and Competitor Analysis #Diagram #SWOT Analysis
-

Circle Split SWOT Analysis Diagram – New Horizons in Market Analysis
#Market and Competitor Analysis #Diagram #SWOT Analysis
-

SWOT Analysis of Popular Career Dreams for Kids
#Market and Competitor Analysis #Diagram #SWOT Analysis
-

SWOT Analysis Arrow Circular Diagram - Market and Competitor Analysis
#Market and Competitor Analysis #Diagram #SWOT Analysis
