Sales and Profit Diagram – Clear Financial Visualization
RM0100017_32
- Last Update 01/30/2025
- File Size 1MB
- # of Slides 2
- File Format PPTX
- Slide Ratio 16:9
- Color
Keywords
- #Content-Based Slides
- #Design-Based Slides
- #Financial Plans and Performance
- #Diagram
- #Capital Requirements
- #Sales and Revenue
- #Table
- #16:9
- #income statement PowerPoint slide
- #financial table presentation
- #revenue comparison slide
- #how to create an income statement in PowerPoint
- #financial data visualization template
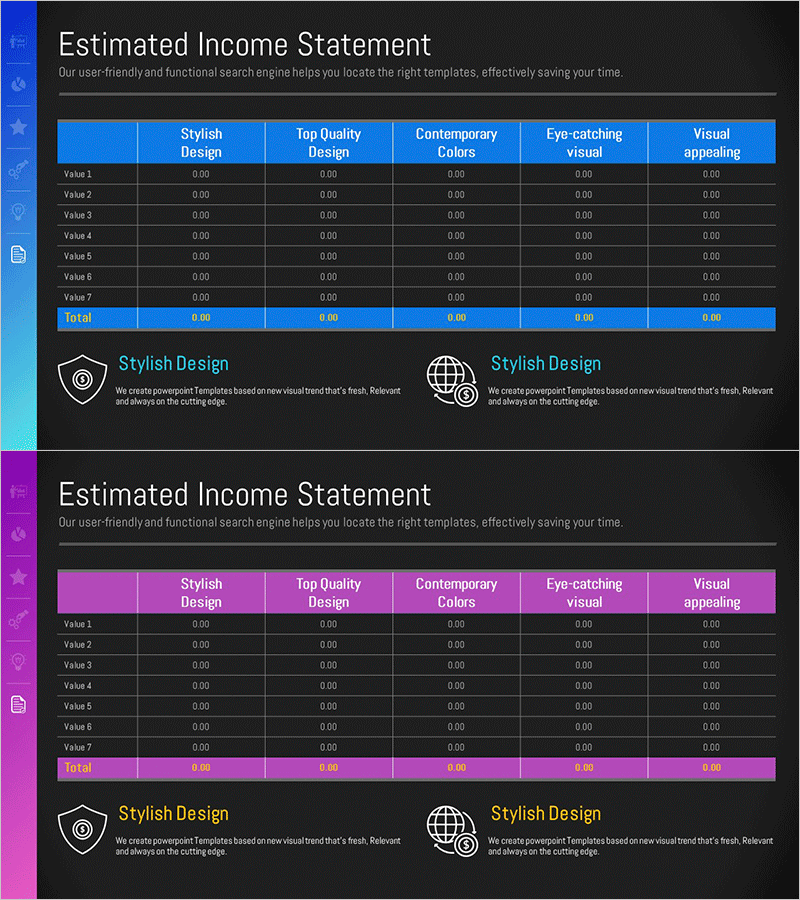
About the Product
A financial data visualization PowerPoint slide featuring an income statement table with dual-tone blue and pink headers. The 6-column comparison layout displays revenue, expenses, profit, and key financial metrics in a structured format ideal for investor presentations, financial reports, and quarterly earnings disclosures. Designed in 16:9 widescreen PPTX format with fully editable text and numerical fields. Two descriptive text areas below the table provide space for additional financial insights or analysis notes.
Usage Points
-
Main Usage
Present financial metrics including revenue, expenses, profit margins, and profitability ratios in a structured tabular format. Enables stakeholders, investors, and executives to quickly assess financial performance and make data-driven decisions.
-
How to Use
Insert into IR decks, business plans, quarterly financial reports, investment pitch presentations, and annual earnings announcements. Replace placeholder values with actual financial data. Customize header labels and row descriptions to match your reporting requirements.
-
Recommended For
CFOs, financial analysts, investor relations managers, startup founders preparing pitch decks, public company earnings presentations, bank loan applications, management consulting reports, and corporate financial planning documents.
-
Slide Structure
Header row contains 5 column categories (Stylish Design, Top Quality Design, Contemporary Colors, Eye-catching Visual, Visual Appealing) with 7 data rows (Value 1–7 and Total). Each cell accepts numerical input. Two text annotation areas positioned below the table for supplementary financial commentary or analysis.
Related Products
-

Diagram Slide for Funding Plans and Sales Statements
#Financial Plans and Performance #Diagram #Capital Requirements
-

Invoice of Required Funds for Financial Planning – A Slide for Efficient Fund Management
#Financial Plans and Performance #Diagram #Capital Requirements
-

Retirement Budget Planning Table – The First Step to Financial Stability
#Financial Plans and Performance #Diagram #Capital Requirements
-

Navy Brown Profit Calculation Table
#Financial Plans and Performance #Diagram #Capital Requirements
