Balance Sheet Analysis Chart – Visualizing Financial Performance
RM0100014_31
- Last Update 01/29/2025
- File Size 0.3MB
- # of Slides 2
- File Format PPTX
- Slide Ratio 16:9
- Color
Keywords
About the Product
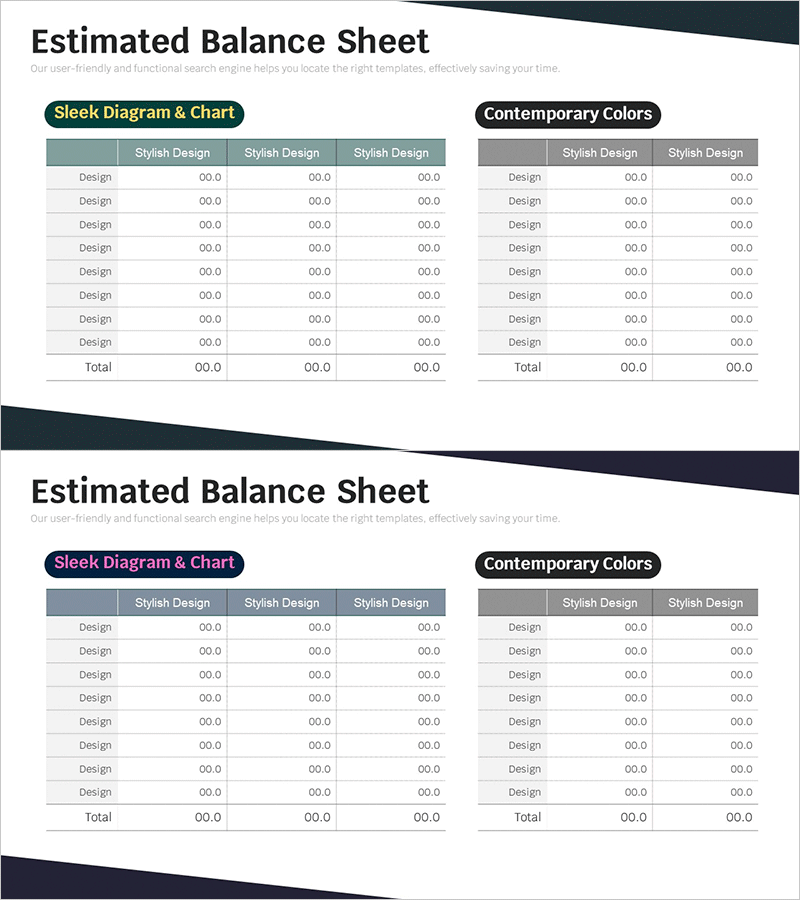
A professional balance sheet PowerPoint slide designed to visualize financial performance with clarity and precision. The slide features two distinct design sections: a sleek diagram style on the left and contemporary color palette on the right, allowing you to present financial data in dual design formats. Each section contains an 8-row by 3-column data table with gray and teal headers on a white background, optimizing readability of financial information. Pair this slide with income statement and cash flow slides to create a comprehensive financial analysis presentation. Provided in fully editable PPTX format, optimized for 16:9 widescreen display.
Usage Points
-
Main Usage
This slide presents corporate financial status in balance sheet format with structured data tables. Assets, liabilities, and equity items are organized numerically, enabling investors, financial institutions, and executives to quickly assess financial position and performance metrics.
-
How to Use
Insert this slide into investor presentations, business plans, or financial reports within the financial analysis section. Choose between the left sleek diagram style or right contemporary color design based on your corporate branding, then populate the table with actual financial figures to complete your presentation.
-
Recommended For
Ideal for CFOs, finance managers, and IR teams presenting financial performance. Recommended for bank loan applications, investment pitch decks, shareholder meeting materials, and any presentation requiring credible financial data communication.
-
Slide Structure
Two-slide set with identical dual-column layouts. Each slide contains two side-by-side sections, each with an 8-row by 3-column data table (7 design items plus total row). Accommodates up to 48 financial data points across both slides for comprehensive financial reporting.
Related Products
-

Yellow Green Income Statement Table – Efficient Financial Analysis
#Financial Plans and Performance #Diagram #Balance Sheet
-

Organizing Insights for Clarity – Emphasizing Financial Planning and Performance
#Financial Plans and Performance #Diagram #Balance Sheet
-

Blue Pink Balance Sheet Slide – Essential for Financial Performance
#Financial Plans and Performance #Diagram #Balance Sheet
-

Visualizing Financial Status with Balance Sheet Table
#Financial Plans and Performance #Diagram #Balance Sheet
