Achievements by Business Year – Systematic Cluster Diagram
RM0100013_5
- Last Update 01/29/2025
- File Size 0.3MB
- # of Slides 2
- File Format PPTX
- Slide Ratio 16:9
- Color
Keywords
- #Content-Based Slides
- #Design-Based Slides
- #Company Introduction
- #Business Strategy
- #Diagram
- #History
- #Step-by-Step Schedule Plan
- #Cluster
- #Closed Cluster Diagram
- #16:9
- #cluster diagram PowerPoint
- #business achievements slide template
- #nested node diagram
- #performance visualization presentation
- #data relationship PPT slide
- #how to create cluster diagram in PowerPoint
About the Product
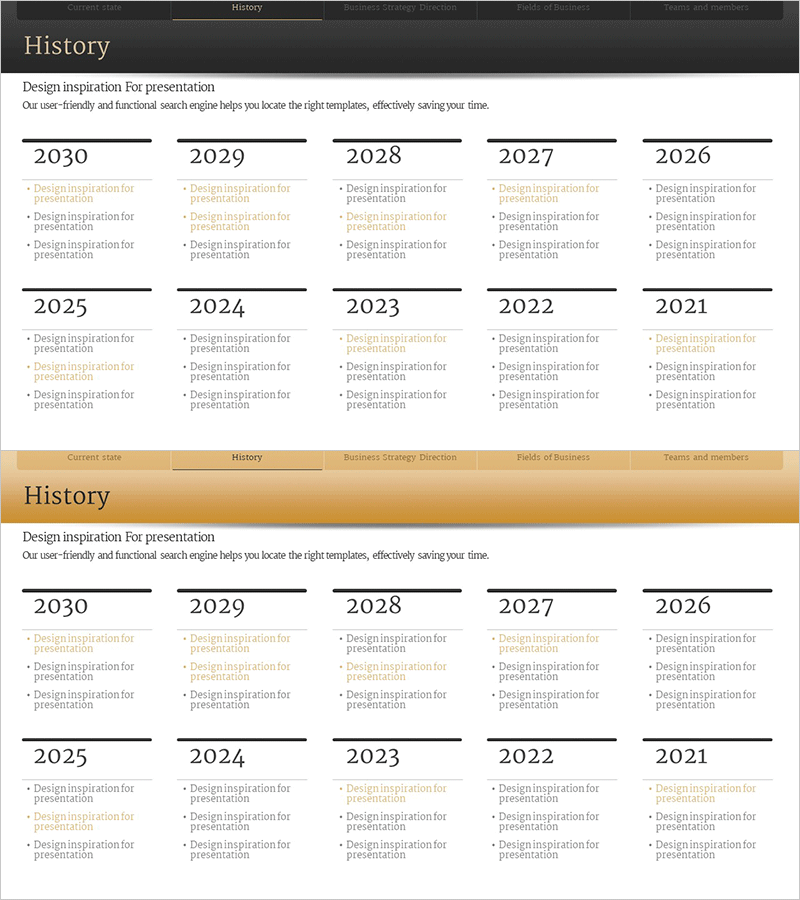
A PowerPoint cluster diagram slide visualizing business year achievements with a nested node structure. The design features a central core element connected to 10 surrounding nodes through gray linking lines, enabling hierarchical representation of annual performance metrics and related indicators. Set against a dark background with white typography, this professional slide deck conveys data relationships clearly and effectively. Provided in 16:9 widescreen format across 2 slides in fully editable PPTX format, optimized for modern projectors and digital displays. Ideal for company presentations, business strategy reviews, performance reports, and investor communications.
Usage Points
-
Main Usage
Visualize business performance metrics and related indicators in a hierarchical, relational structure for executive reports, investor presentations, and annual business reviews. The nested node layout clearly communicates data dependencies and connections, making complex performance data accessible to stakeholders.
-
How to Use
Enter annual performance metrics (revenue, customer count, project volume) into each node and customize text labels. Adjust node colors through shape formatting options and add additional nodes by copying existing shapes. Modify font sizes and connector line thickness to match presentation context and ensure readability across different screen sizes.
-
Recommended For
Executives, business managers, marketing teams, financial analysts, and consultants presenting business performance analysis, strategic planning, and investment pitches. Particularly effective for multi-year comparative analysis, departmental performance consolidation, and business portfolio visualization.
-
Slide Structure
2-slide deck featuring a dark background with a central hub element connected to 10 surrounding nodes via gray connector lines in a nested cluster arrangement. The second slide offers a structural variation with alternative color or layout options. Delivered in 16:9 widescreen format with fully editable text and shapes in PPTX format.
Related Products
-

Founding and History of Interior Design Company - Innovation and Growth
#Company Introduction #Business Strategy #Diagram
-

Clothing Business History Diagram – Innovation and Growth
#Company Introduction #Business Strategy #Diagram
-

Basic History Introduction Slides – Overview of Company History
#Company Introduction #Business Strategy #Diagram
-

Timeline of Art Education Initiatives – Business Strategy and History
#Company Introduction #Business Strategy #Diagram
