User Analysis Graph – Insights and Analysis Tool
RM0100007_8
- Last Update 01/26/2025
- File Size 1.2MB
- # of Slides 2
- File Format PPTX
- Slide Ratio 16:9
- Color
Keywords
About the Product
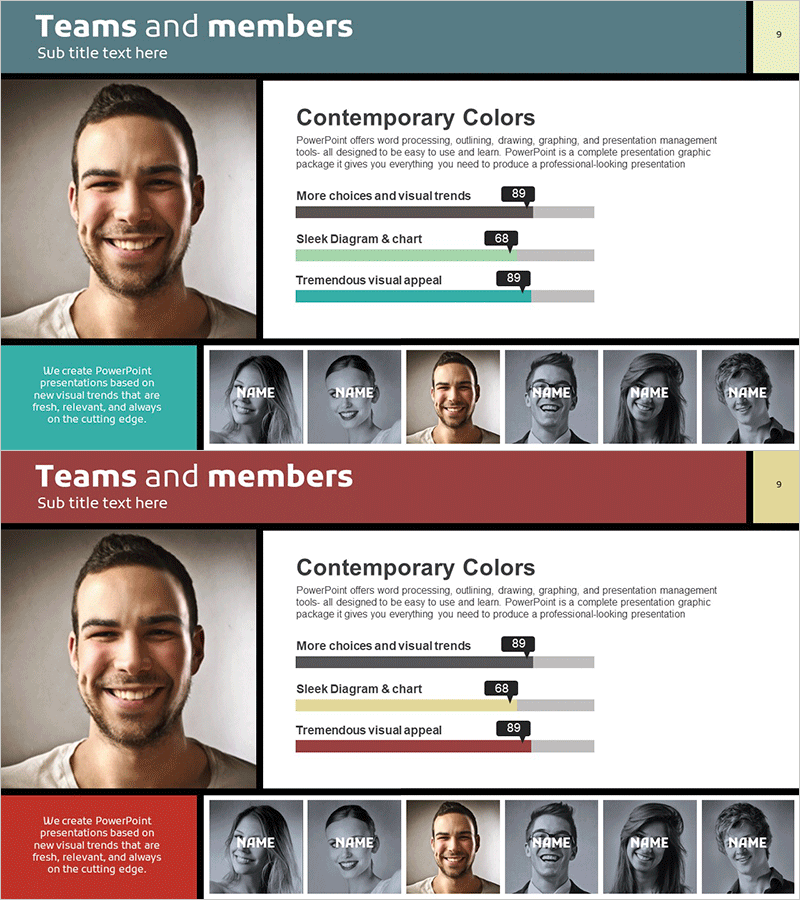
A professional team introduction PowerPoint slide optimized for company presentations and organizational overviews. Features a large portrait photo on the left, team characteristic evaluation chart on the right, and a gallery of 6 member thumbnails at the bottom, effectively showcasing your organization's human assets with credibility. Available in three color versions—teal, burgundy, and gray—to match your corporate brand. Clear separation of text and image areas ensures easy editing. Perfect for investor pitches, partner meetings, employee onboarding, and company introduction presentations where you need to communicate team composition and capabilities effectively.
Usage Points
-
Main Usage
Visually emphasize your team's human assets and capabilities in company presentations and organizational introductions. The large portrait photo combined with team characteristic evaluation chart conveys both organizational credibility and professional expertise, leaving a positive impression on investors and partners.
-
How to Use
Insert a team leader or key personnel portrait in the left image area. Enter team strengths (visual trends, chart clarity, innovation) as numerical values in the right chart. Arrange team member photos in the 6 bottom thumbnails to represent organizational composition. Select the color version that matches your corporate brand identity.
-
Recommended For
Ideal for company profile presentations, organizational introductions, investor relations pitches, partner meetings, employee onboarding sessions, and recruitment briefings where you need to effectively introduce team composition and capabilities. Particularly suited for situations emphasizing human capital and organizational credibility.
-
Slide Structure
2-slide set with each slide featuring a large editable portrait photo on the left, title and subtitle text area in the upper right, 3-item horizontal bar chart with score indicators in the middle right, and a 6-person thumbnail gallery at the bottom. Optimized for 16:9 widescreen format for modern presentation environments.
Related Products
-

Human Resources Data Analysis - Effective Customer Management Strategies
#Company Introduction #Market and Competitor Analysis #Diagram
-

Key Customer Analysis Data Charts – Assessing Market and Competition
#Company Introduction #Market and Competitor Analysis #Diagram
-

Athlete Competency Chart for Standardized Customer Analysis – Strengthening Competitiveness
#Company Introduction #Market and Competitor Analysis #Graph
-

National Progress Chart – Visualization for Market Analysis
#Market and Competitor Analysis #Graph #Other
